Navigating the Automox Console
This guide introduces the structure of the Automox console and explains how to find key functionality using the top navigation tabs: Dashboard, Devices, Automate, Manage, Insights, and the per-organization Settings menu. It also explains how to access the Global View, which provides centralized account and user management across all organizations.
Use this guide as a reference when other articles refer to filters, navigation paths, or role-based access. This centralized explanation ensures those elements are documented in one place.
Console Overview
The Automox console uses a horizontal top navigation bar. Each top-level tab opens a corresponding page and may display subcategories within the main content area. The animation illustrates these subcategories. For details about accessing organization settings and the Global View, see Accessing Settings and Global View.
| Top-Level Tab | What You Can Access |
|---|---|
| Dashboard | Device and policy status, outstanding patches, chronological scrollable list of scheduled policies |
| Devices | Device inventory, Device Details, Device Logs, and Device Explorer |
| Automate | Policies, Worklet Catalog, and Remediations |
| Manage | Groups, Software, Manual Approvals, and Scheduled Windows |
| Insights | Analytics dashboards and Reports |
Dashboard
The Dashboard is the default landing page in the Automox console. It provides a summary of device and policy status, outstanding patches, a chronological scrollable list of scheduled policies, and quick access to troubleshooting resources.
For details about the dashboard, see Automox Console Dashboard.
Devices Tab
Use the Devices tab to access the Devices page, Device Details, and Device Explorer.
Devices Page
The Devices page lists all devices in your organization. From this page, you can view device status, apply filters or search terms to refine results, initiate scans or restarts, and open individual device details for more information. See Managing Devices.
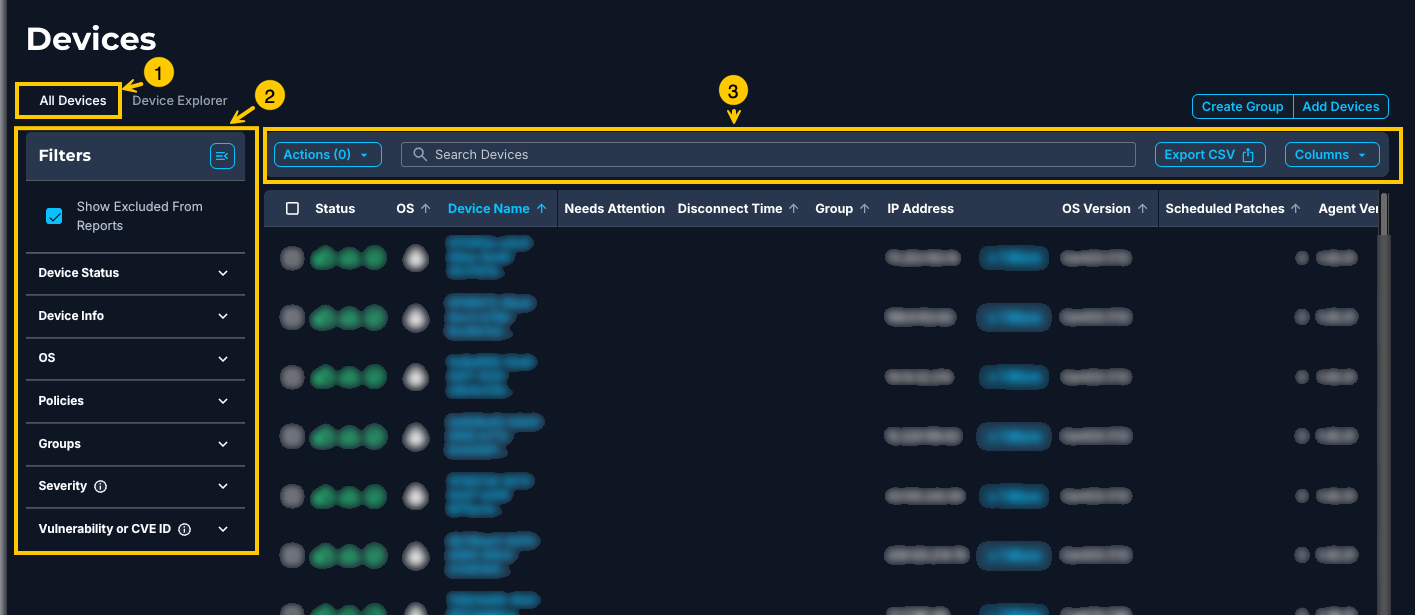
The following numbers correspond to the elements highlighted in the image:
- Page tabs: Access the All Devices view or the Device Explorer.
- Filter panel: Filter devices by properties such as status, OS, or severity.
- Table toolbar: Search, export, and manage visible data.
Device Details
The Device Details view provides comprehensive information about a single device. Depending on your plan, this page includes device inventory details such as kernel status, operating system version, device drivers, update settings, and configuration information. For more information, see Device Details.
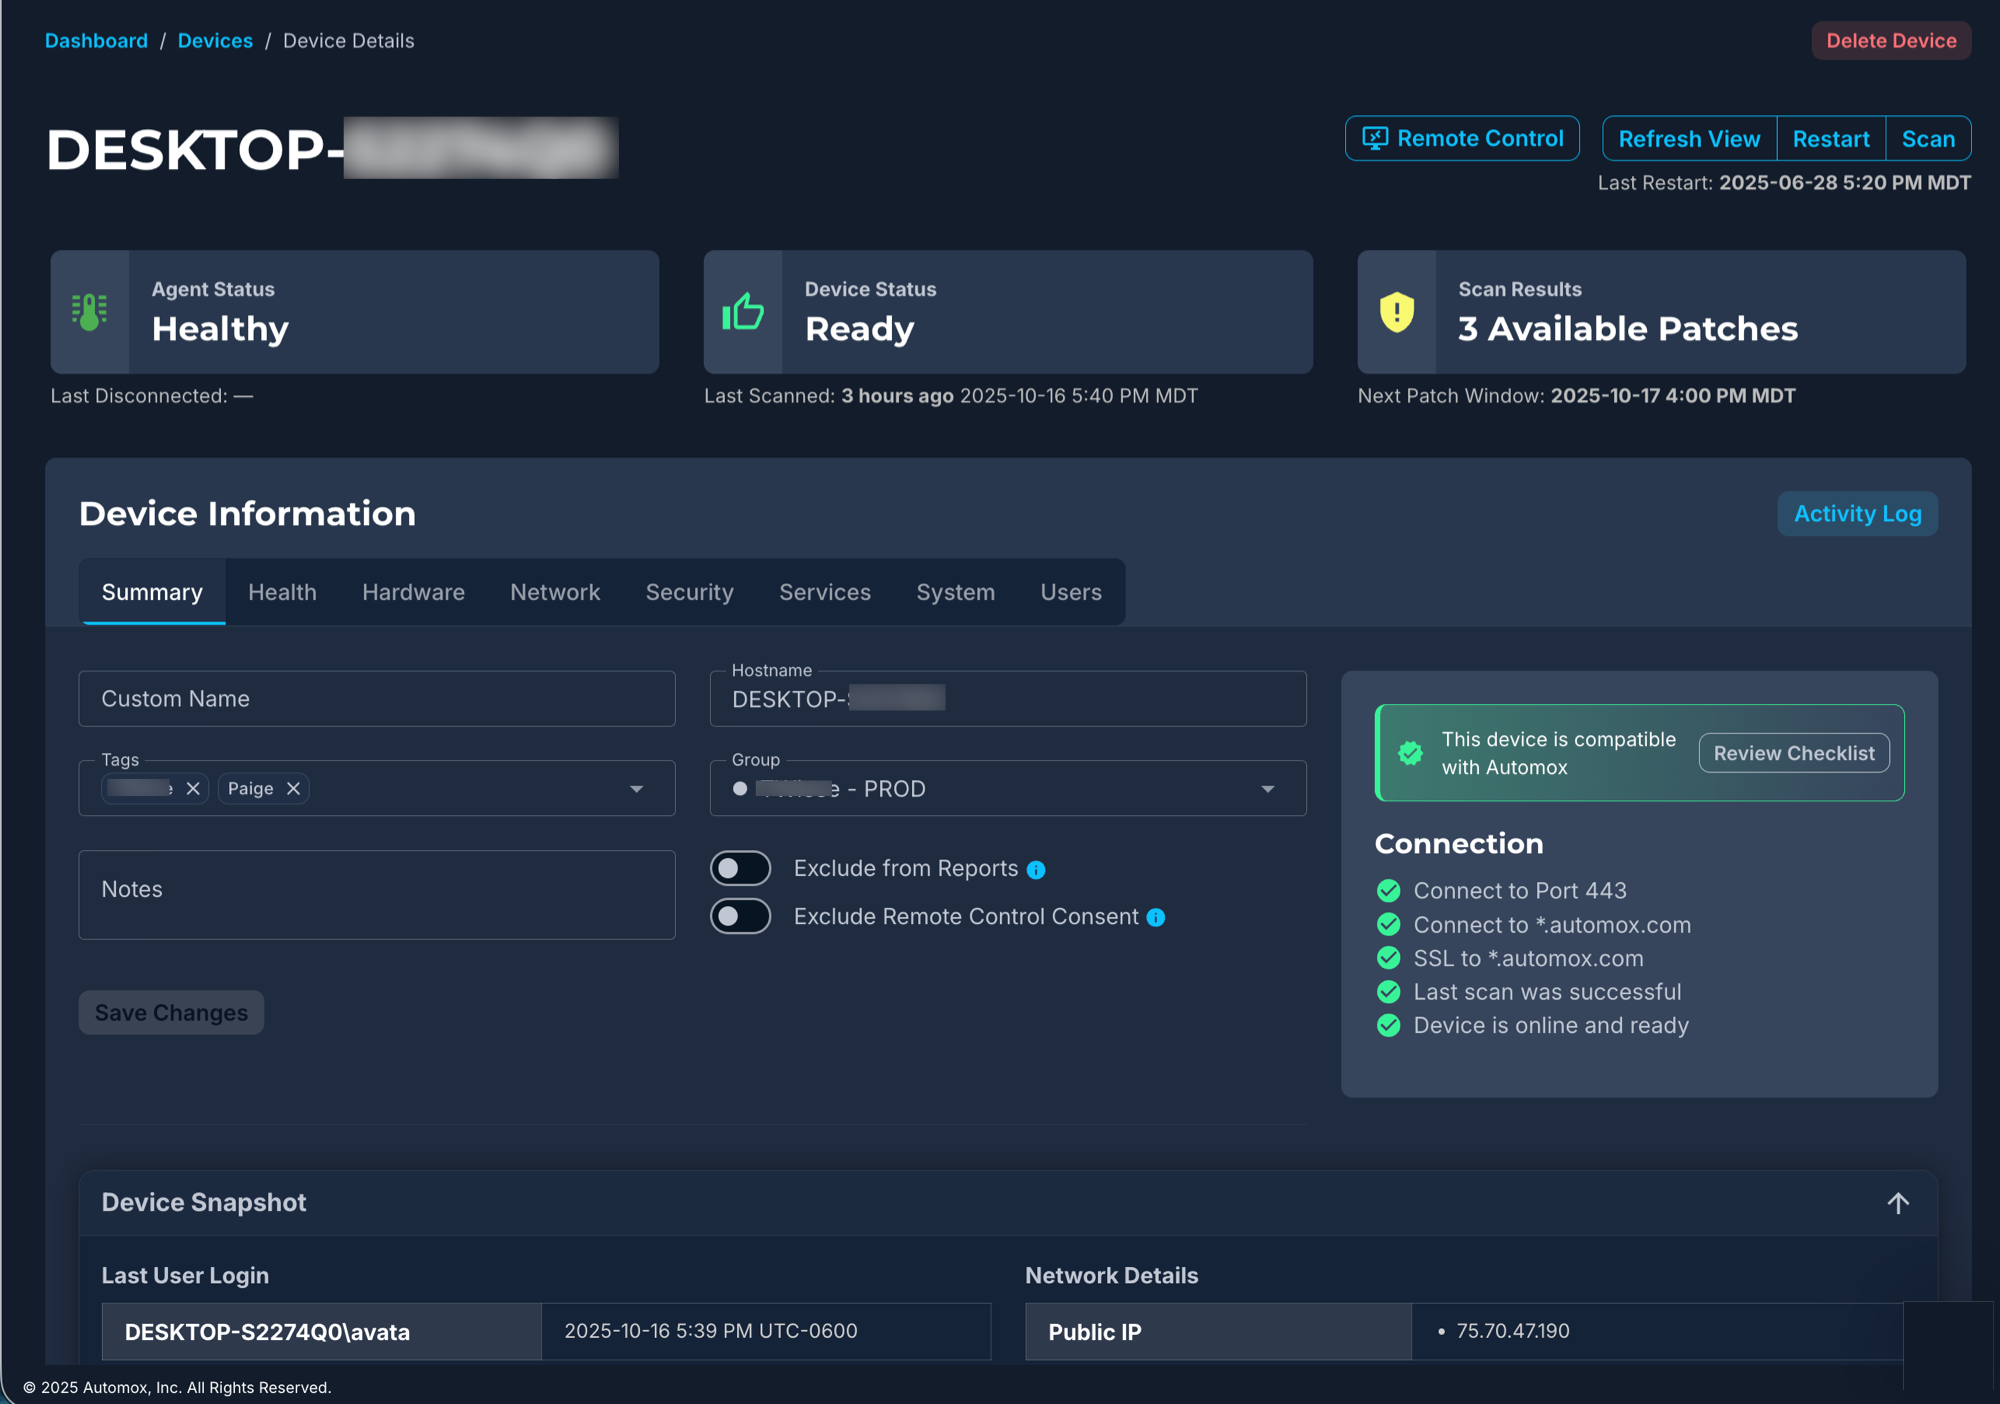
Each Device Details page also includes a Device Snapshot section that summarizes key information such as operating system, agent version, and last check-in time.
From the same page, you can also access Device Logs, which provide recent activity details from device scans.
Device Explorer
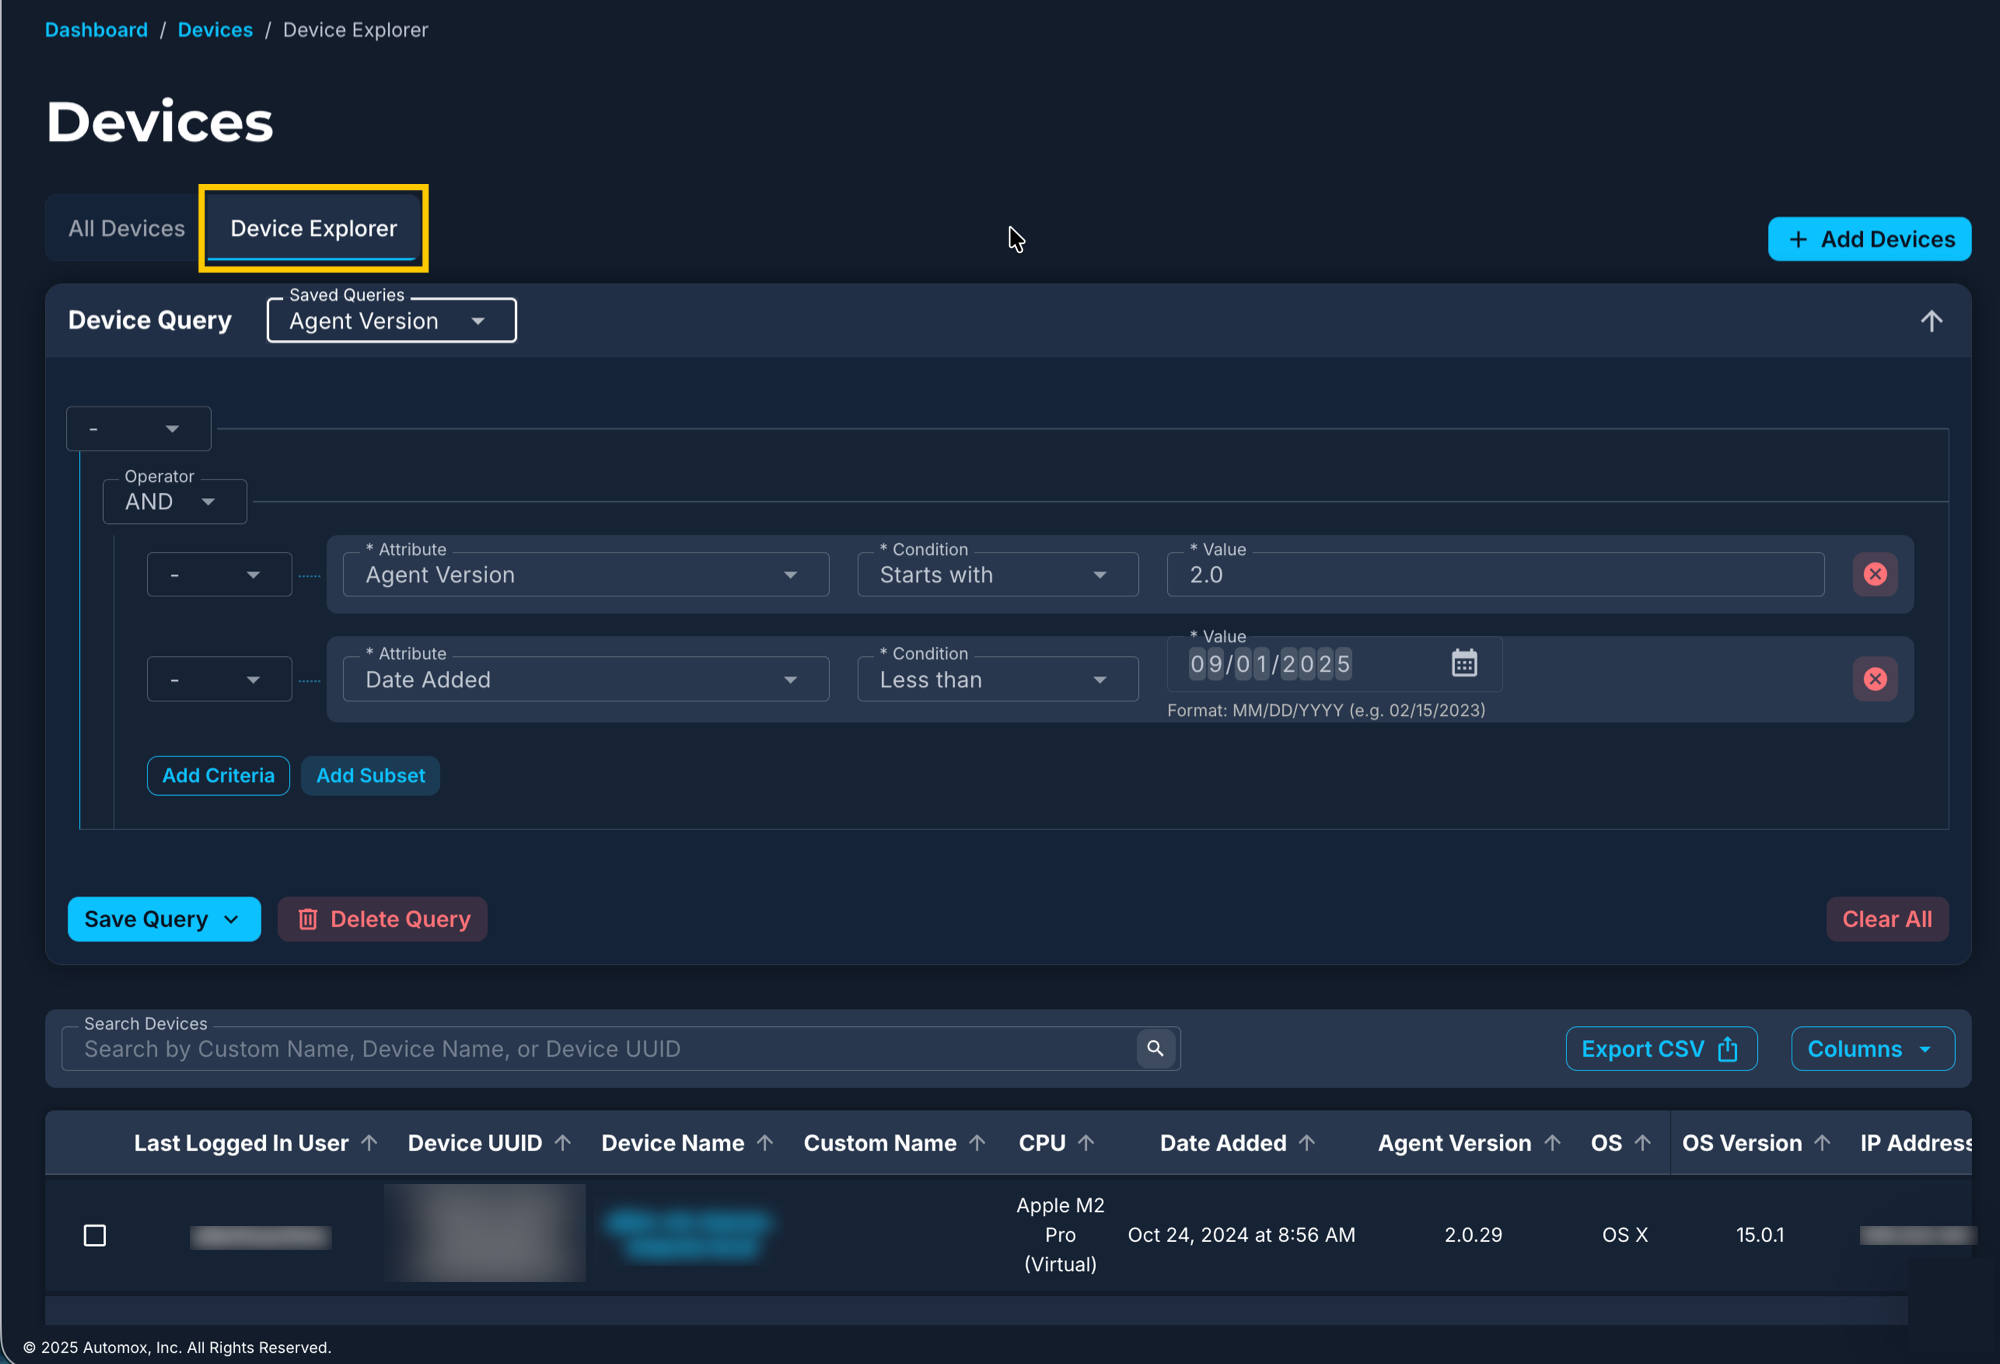
The Device Explorer is a separate view available under the Devices tab. It allows you to create and run queries that filter devices based on selected attributes. Each query acts as a reusable ruleset for targeting devices that meet specific criteria. For more information, see Device Explorer.
Manage Tab
Use the Manage tab to access groups, software, manual approvals, and scheduled windows.
- Groups: Define group membership for targeting policies
- Software: View and search for software installed across devices
- Manual Approvals: Approve or reject policies awaiting admin input
- Scheduled Windows: Control when Automox performs or pauses tasks on devices
For more information about these areas, see Managing Groups, Viewing Software Inventory, Using a Manual Approval Policy, and Scheduled Windows.
Insights Tab
Use the Insights tab to access analytics dashboards and reports.
- Analytics: Measure patching progress, identify security gaps, and view data-driven insights across your devices
- Reports: Access prebuilt reports to review operational trends and device management data
For more information about analytics and reporting, see Analytics and Creating Reports.
Filtering and Search
Filter panels and search fields appear throughout the Automox console to help refine visible data.
Filter Panels
Filter panels appear on the left side of pages like Devices, Software, and Policies. The following are examples of what you might filter data by:
- Device information such as IP address
- Operating system (OS)
- Severity
- Groups
- Status
When a filter is selected, the number of selected items is shown in parentheses. Further options are:
- Clear individual filters or use Clear All
- Collapse the filter panel to save space
- Maintain filters when navigating away and returning. Settings are generally saved in the URL.
Search Fields
Search bars appear above tables and update results in real time. Some examples of what you can search by are listed here:
- Device name
- Tag
- Policy name
- Software title
Search supports partial string matches and works alongside filters.
Customizing Table Columns
Many pages in the Automox console include a Columns button that allows you to control which data is displayed in tables.
To customize columns:
- Click the Columns button above the table
- Select or deselect checkboxes to show or hide specific columns
- Drag and drop column names to rearrange the order
To view off-screen data, use the horizontal scroll bar at the bottom of the table. You can also scroll using the arrow keys on your keyboard.
Sorting Tables
Most tables in the Automox console allow you to sort data by clicking the arrow next to the column header. Each click toggles between ascending and descending order. Sorting updates the visible data but does not affect any applied filters or searches.

Exporting Data
Many pages in the Automox console include an Export CSV option that allows you to download data for external review or reporting. You can export table data from the Devices page, Device Explorer, Software, Activity Log, and Policy Results Report.
Some pages also include options to export data in other formats, such as PDF.
Accessing Settings and Global View
The Automox console includes both organization-level and account-level settings, which you can access from the upper-right corner of the console. The options available to you depend on your account-level or global-level permissions.
Organization Settings
To access per-organization settings, locate the settings icon in the upper-right corner of the console.
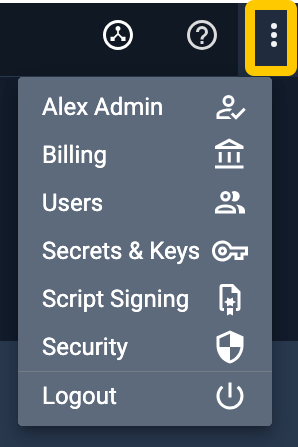
- Click the three vertical dots icon (⋮) in the upper-right corner.
- From here you can select from the list: Profile, Agent, Billing, Users, Secrets & Keys, Script Signing, Security, and Logout.
This opens the Settings page to the selected tab. These settings apply only to the selected organization.
Global View (Global Access Management)
The Global View provides centralized account-level administration for Automox users who are managing one or more organizations from the Setup & Configuration page. Access to the Global View depends on your account-level or global-level permissions.
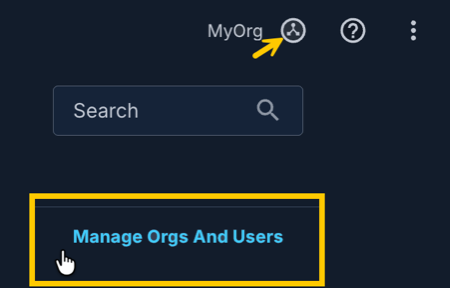
To access Global View:
- Click the organization selector in the upper-right corner.
- Select Manage Orgs and Users to open the Setup & Configuration page.
- From here you can select from the tabs: Keys, Organizations, Roles & Permissions, Users, and Settings.
Quick Reference: Where to Find Key Features
Use this table to locate common tasks in the Automox console.
| Task | Where to Go |
|---|---|
| Add and manage devices | Devices |
| Create or manage policies | Automate → Policies |
| Use or browse Worklets | Automate → Worklet Catalog |
| Manually approve policy actions | Manage → Manual Approvals |
| Create or manage exclusion windows | Manage → Scheduled Windows |
| View analytics dashboards | Insights → Analytics |
| Export reports | Insights → Reports |
| Access organization settings and details | Settings (⋮) icon → Select an option from the drop-down menu |
| Manage organizations and users globally | Global View |
