Device Details
The Device Details![]() Per-device information page (hardware, OS, patches, software) page provides an organized inventory of data collected for individual devices
Per-device information page (hardware, OS, patches, software) page provides an organized inventory of data collected for individual devices![]() A subset of Assets, a general term denoting anything that runs the Automox Agent and is registered with the system.. This updated experience introduces new categories of information and arranges them in a tabbed layout that includes Summary, Health, Hardware, Network, Security, Services, System, and Users.
A subset of Assets, a general term denoting anything that runs the Automox Agent and is registered with the system.. This updated experience introduces new categories of information and arranges them in a tabbed layout that includes Summary, Health, Hardware, Network, Security, Services, System, and Users.
Each tab presents device-specific data to help administrators verify configuration, investigate issues, and take appropriate action. The page also includes options to restart a device, initiate a scan, delete the device, or run a policy![]() Represents a set of logic statements that define the desired target state of a device, the allowed remediation schedule, and configuration parameters around how that remediation should take place..
Represents a set of logic statements that define the desired target state of a device, the allowed remediation schedule, and configuration parameters around how that remediation should take place..
Notable changes include:
- New tabbed structure for navigating device information
- Significant expansion of available data points across all categories
- Device Snapshot
 Summary section on Device Details with key device information. section for quick reference to system and network details
This documentation describes how to access and use the Device Details page to review device data and perform management tasks.
The Automox Platform and available plans are described here: Automox Plans
Viewing Details for a Device
To view details for an individual device in your organization, follow these steps:
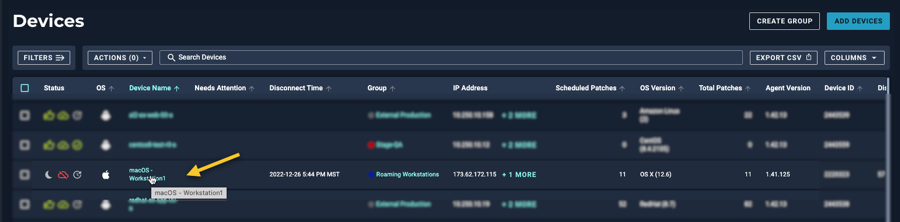
- Click Devices to view the list of devices for your organization.
- Hover over the device name of the device that you want to view details for. If a custom name has been created for this device, you see that listed here.
- Click the name to open the details view for that device.
Taking Action on a Device
You can take the following actions on a device from either the Devices page or the Device Details page. The available actions depend on which page you are viewing.
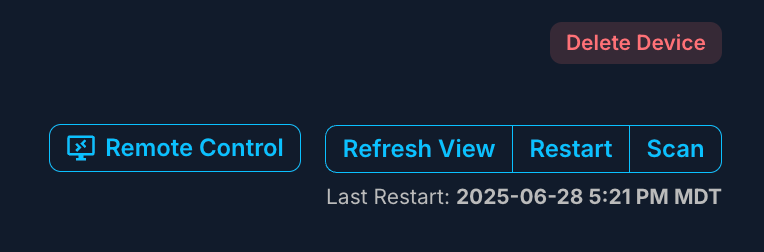
- Remote Control: Start a remote control session for the selected device (if enabled for your device).
- Refresh View (Device Details page only): Reload the Device Details page to view the most current information without initiating a new scan.
- Restart: Restart the device. You must confirm the action before it proceeds.
- Scan: Run a scan to retrieve the latest status of the device.
- Delete Device: Remove the device from Automox.
The Last Restart timestamp below the controls shows the date and time the device was last restarted.
Device Details Fields
The following describes the fields on the Device Details page. This includes the device status tiles, Device Information, Device Snapshot, Device Logs, Associated Policies, and Software. See also Data Refresh Intervals and Data Availability Notes.
Device Status Tiles
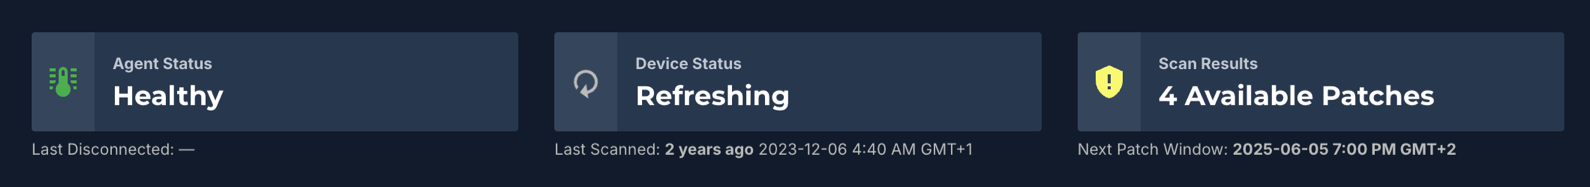
The status tiles provide immediate important information about the device.
Agent Status
The two possible agent status states are described here.
|
Status |
Description |
|---|---|
|
Healthy |
This status indicates that all data points evaluated in the healthy data check have passed the health check. The device's data is complete, current, and consistent with expectations. |
| Health Warning | This status appears when at least one inventoried data point from the healthy data check fails the health check. This can signal missing, outdated, or inconsistent data that requires review or remediation. See Health. |
Device Status
The following lists the status of a device and the description for that status.
|
Status |
Description |
|---|---|
|
Initializing |
This indicates that the device has successfully connected to Automox, but has not yet completed the first system scan. |
|
Installing |
This indicates that a patch is being installed. |
|
Uninstalling |
The device is currently uninstalling software, per a policy. |
|
Needs Restart |
The device has installed patches or software that require a restart before installation can be fully completed. |
|
Rebooting |
This appears when Automox restarts a system due to patching or when the administrator initiates a restart through the console. |
|
Refreshing |
The device is updating previously scanned software and hardware configurations or a worklet is being tested. |
|
Ready |
No command is impacting the device. |
|
Not Ready |
This status appears when the device is disconnected. |
|
Pending |
This status can indicate that a command is running on the device or that a worklet is executing on the device. |
| Pending User Install |
Indicates whether the device is currently in a pending state due to install notifications. Note:This requires that Agent version 2.1.x or later be installed on the device. |
| Pending User Restart |
Indicates whether the device is currently in a pending state due to restart notifications. Note:This requires that Agent version 2.1.x or later be installed on the device. |
Device Status FAQs
![]() How can I use the "Pending User Install" and "Pending User Restart" statuses?
How can I use the "Pending User Install" and "Pending User Restart" statuses?
![]() Does this change how policies run?
Does this change how policies run?
![]() Why don’t I see these new statuses or columns?
Why don’t I see these new statuses or columns?
Scan Results
The scan results tile provides information about available patches detected during the most recent scan. It does not include patches already accounted for in your patch policies.
Device Information
The following sections provide an overview of the device information that is available in the tabs:
You can find detailed descriptions of all categories at Device Inventory.
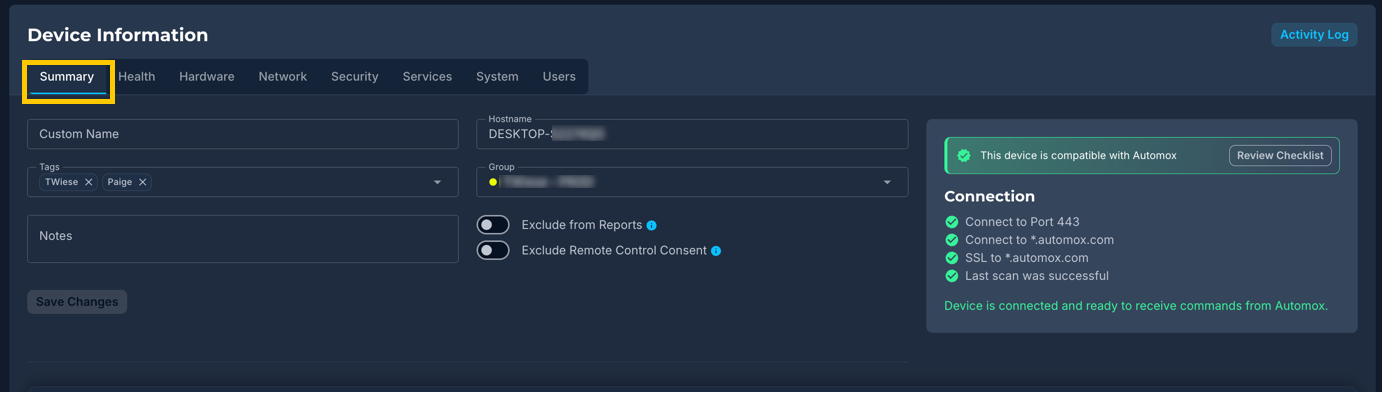
Summary
The Summary tab provides a high-level overview of the device, including editable identification fields, current status indicators, group assignments, and essential troubleshooting context. It is available on all Automox plans and is the default landing tab when viewing device details.
| Summary | Description |
|---|---|
| Custom Name | A user-defined name for the device. You can edit this field directly and select Save Device to apply the change. |
| Hostname | The system-assigned name for the device. |
| Tags | Shows existing tags applied to the device. You can add or edit tags from this section. |
| Group | Indicates the device group assignment. You can change the group directly from this view. |
| Exclude From Reports |
This shows if this device has been marked as an exception and is therefore excluded from statistics, but is still monitored. To do this, switch the Exclude From Reports toggle on or off. Note: Devices excluded here are omitted from the outstanding patch count shown on the dashboard. |
| Exclude From Remote Control Consent | Configure the consent required for remote control sessions. |
| Connection | Indicates whether the device has checked in with the Automox API within the last two minutes. Refer to the Compatibility Checklist for further details about troubleshooting this status. |
| Save Changes | Make sure to save and confirm changes made in this section. |
Compatibility Checklist
The Compatibility Checklist is available from both the Summary and Health tabs. It allows you to assess whether Automox can manage the device by checking agent status, connectivity, and platform readiness.
You can also initiate a Check Device scan from either tab to run these checks in real time. In the Health tab, additional troubleshooting details are available.
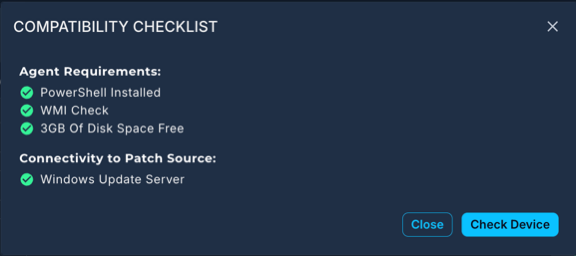
- Review Checklist: Opens a detailed view of the device's compatibility with Automox management. This includes agent and connectivity checks, as well as platform-specific readiness requirements.
- Check Device: Triggers a real-time compatibility scan to detect issues such as missing OS prerequisites or failed agent configuration.
- Connection Check: When the device details page loads, a basic connection test checks if the device can access automox.com over port 443 with SSL. Failed checks may point to firewall, proxy, or certificate issues.
Health
The Health tab provides diagnostic information that supports device troubleshooting, connection status verification, and compatibility assessment.
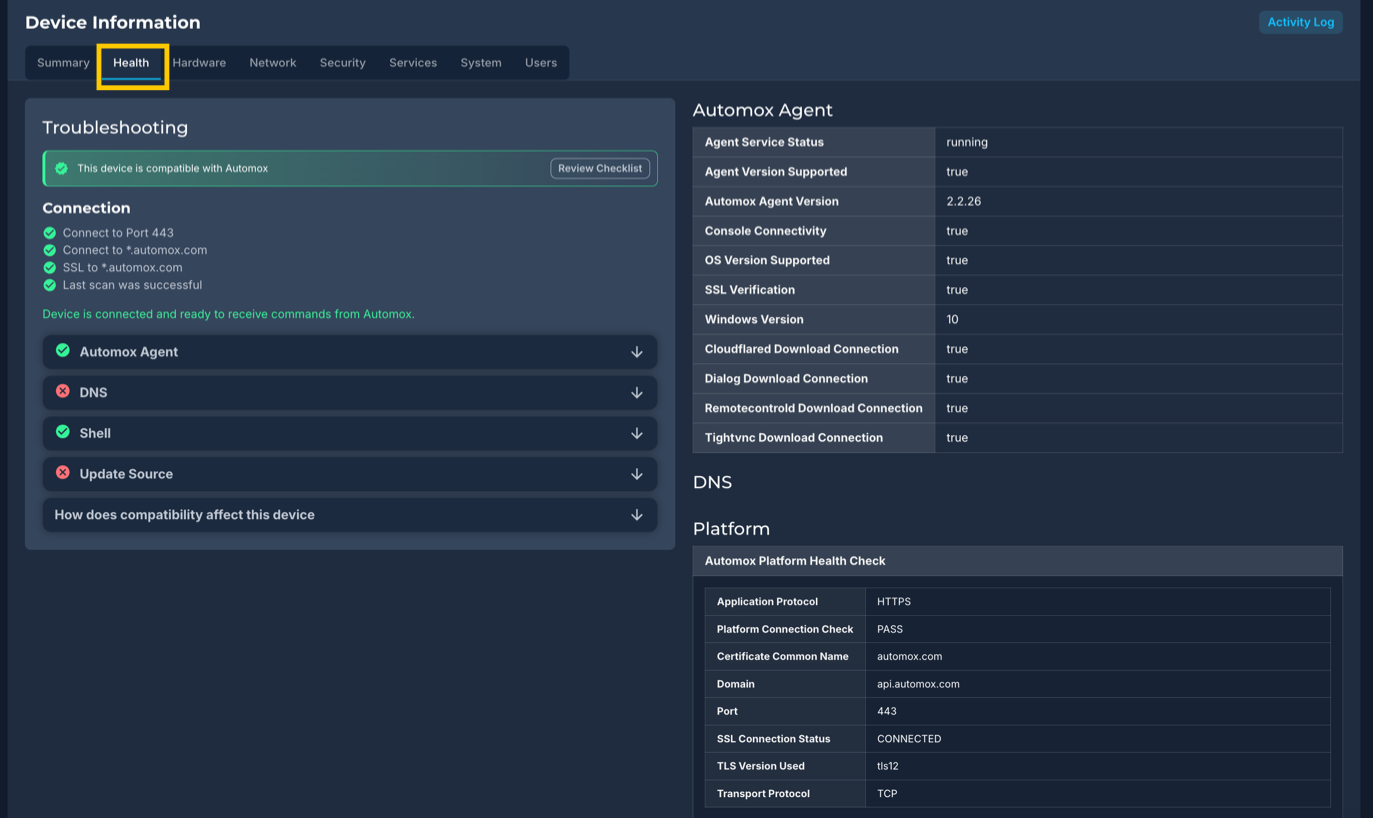
Available Sections
- Troubleshooting: Offers a connection status check (via port 443 and SSL to automox.com) and details from the latest system scan. This section helps identify communication failures or API check-in issues. Refer also to Compatibility Checklist.
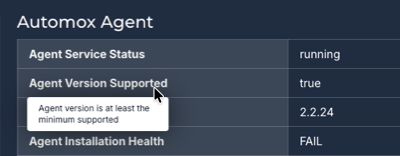
- Automox Agent
- DNS
- Platform
- Shell
Hardware
The Hardware category captures detailed system hardware data across Windows, macOS, and Linux endpoints. It monitors BIOS configurations, CPU specifications, memory capacity and layout, motherboard identifiers, and network interface details. The category also tracks USB device properties and operating system firmware attributes, including boot type and management values.
Available Sections
- BIOS
- CPU
- Disk
- Hardware
- Memory
- Video
- Volume
For detailed descriptions of this data category, see Device Inventory: Hardware Information.
Network
The Networking category tracks key network interface and connectivity data across Windows, macOS, and Linux systems. It monitors IP and MAC addresses, connection states, interface speeds, and error metrics to support performance diagnostics and device identification. The category also tracks listening ports and connection identifiers, giving you visibility into open network services and active communication paths across your environment.
Available Sections
- DNS
- Interface
- IP Address
- Port
- Route
For detailed descriptions of this data category, see Device Inventory: Networking.
Security
The Security category monitors critical security configurations across Windows, macOS, and Linux systems. It captures detailed data on digital certificates and SSH keys—including expiration dates, key strength, issuer details, and storage paths—to support credential auditing and trust validation. The category also tracks firewall configurations on Windows devices and hardening measures like screen lock status, Secure Boot, SELinux enforcement, and shell history.
Available Sections
- Bitlocker
- Firewall
- Shell
For detailed descriptions of this data category, see Device Inventory: Security.
Services
The Services category monitors background services across Windows, macOS, and Linux systems. It tracks key data points from service managers like launchd, systemd, and the Windows Service Control Manager, providing visibility into service names, startup behavior, running states, configuration paths, and execution parameters. This information helps you audit service activity, troubleshoot performance issues, and enforce secure, policy-aligned operations across your entire environment.
Available Sections
- Services
- WSUS
For detailed descriptions of this data category, see Device Inventory: Services.
System
The System tab provides detailed visibility into system-level attributes across Windows, macOS, and Linux devices. It monitors kernel versions, boot configurations, package managers, and driver statuses, along with operating system versions, architectures, firmware types, and localization settings. Additional tracking includes reboot requirements, update sources, SSH configurations, Active Directory settings, system UUIDs, and more.
Available Sections
- Auto Update
- AWS Metadata
- Configuration
- Driver
- Kernel
- Locale
- Operating System
- Optional Feature
- Restart
- Shell
- Software
- Update
- Update Source
- Uptime
For detailed descriptions of this data category, see Device Inventory: System Data.
Users
The Users category monitors user account activity and login behavior across Windows, macOS, and Linux systems. It tracks authentication events—including timestamps, login types, and source IPs—along with session IDs, user identifiers, group memberships, and password changes. The category also captures diagnostic data related to application crashes during user sessions.
For detailed descriptions of this data category, see Device Inventory: User Management.
Device Snapshot
The Device Snapshot section is collapsed by default. Select the arrow to expand and view key system and network details for the device, including hardware specifications, agent version, IP addresses, and user login information.
| Device Snapshot | Description |
|---|---|
| Last User Login | The login name of the user who logged into the device. |
| System Details |
|
| Automox Agent Version | The version of the Automox agent installed on the device. |
| Active Directory - Organizational Unit | The active directory OU filter path, if configured. |
| Network Details |
|
Data Refresh Intervals
The majority of device data is updated every 24 hours. Some data points, like reboot status, are updated every hour. Others are updated on a weekly interval due to their relatively static nature.
Additionally, automatic updates are also paused when a tab loses focus. If you see a notification that data is no longer refreshing, simply reload the page to start a new 5-minute update cycle.
Typical scan intervals for select data points
- Reboot status: Scanned every hour
- Logged in users: Scanned every 24 hours
- Available updates: Scanned every 24 hours
- Time zone: Scanned on a weekly basis
- CPU information: Scanned on a weekly basis
Data Availability Notes
- Initial sync delay: New devices require 5—10 minutes before data begins populating
- Offline devices: Do not receive data updates while disconnected
- Agent requirements: Devices must be running Agent version 2.1 or later to access the new inventoried data
- Version limitations: Devices running Agent versions earlier than 2.1 see the redesigned Device Details page with a banner but cannot view or access the new inventoried data
- Partial support: Devices running versions between 2.1 and 2.2 might not receive all inventoried data points
- Empty fields: Not all devices return all data; collection scripts gather data only if it exists
Device Logs
The Device Logs section displays additional information from recent device scans.
This section is collapsed by default. To expand it, click the arrow to the right of the section header.
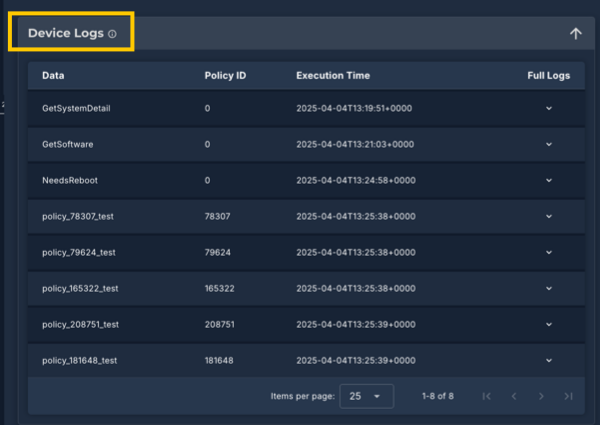
Viewing Logs
If the device has been scanned within the past 30 days, a table appears with the following columns:
- Data: See Type of Data
- Policy Name: Click the name to view the policy.
- Policy ID: The policy associated with the scan, if applicable
- Execution Time (UTC): The timestamp of when scan occurred
- Full Logs: The detailed log information for each scan, if available
Type of Data
The Data column lists the log type that was recorded. The following types can be included here:
- Get Software
- Get System Details
- Evaluation of Worklets
- Remediations
- Modify OS Auto Update
- Reboot
- Needs Reboot
You can expand each entry in the Full Logs column to view the complete log. If the log content exceeds a certain length, a Show More link appears to expand the full output. This behavior matches the CVE column in the Pre-Patch report.
Scan History and Availability
Logs appear for the most recent four scans, as long as those scans occurred within the last 30 days.
Additionally, a shortcut link to Device Logs is available from the Full Logs column in the Activity Log Report.
Associated Policies
From the Associated Policies section of the device details page, you can quickly view which policies the device is assigned to and what the schedule is. From here you can manually start the policy run outside of the schedule or manage the policies of the default group.
|
Associated Policies |
Description |
|---|---|
|
Policy Name |
User-defined policy name |
|
Update Schedule |
This is the text description of when the policy updates. |
|
Schedule Time |
The time at which the policy is scheduled to execute. |
|
Next Patch Window |
The date and time for the next patch window for that policy. |
|
Run On This Device |
Click to immediately run the policy. Important: This runs the policy for the selected device. This has no effect on disconnected devices. Note: You must confirm the action in the Run Policy window for it to proceed. |
|
Manage Policies of the selected Group |
Click the Manage policies button to manage which policies are associated with the current group. |
| Active Notification |
Indicates:
Note:This requires that Agent version 2.1.x or later be installed on the device. |
| Notifications Enabled |
Indicates whether install or restart notifications are enabled for the policy. Possible values:
Note:This requires that Agent version 2.1.x or later be installed on the device. |
The Device Details page uses the following icons.
|
Associated Policies Icons |
Description |
|---|---|
|
|
The policy has no items pending to install. The policy does not run at the next scheduled runtime. |
|
|
The policy has items to install upon the next run (whether scheduled or manual). |
|
|
The last time the policy ran, it encountered an error. You can find error information in the activity log or needs attention reports. The status will be cleared upon a successful execution of the policy. |
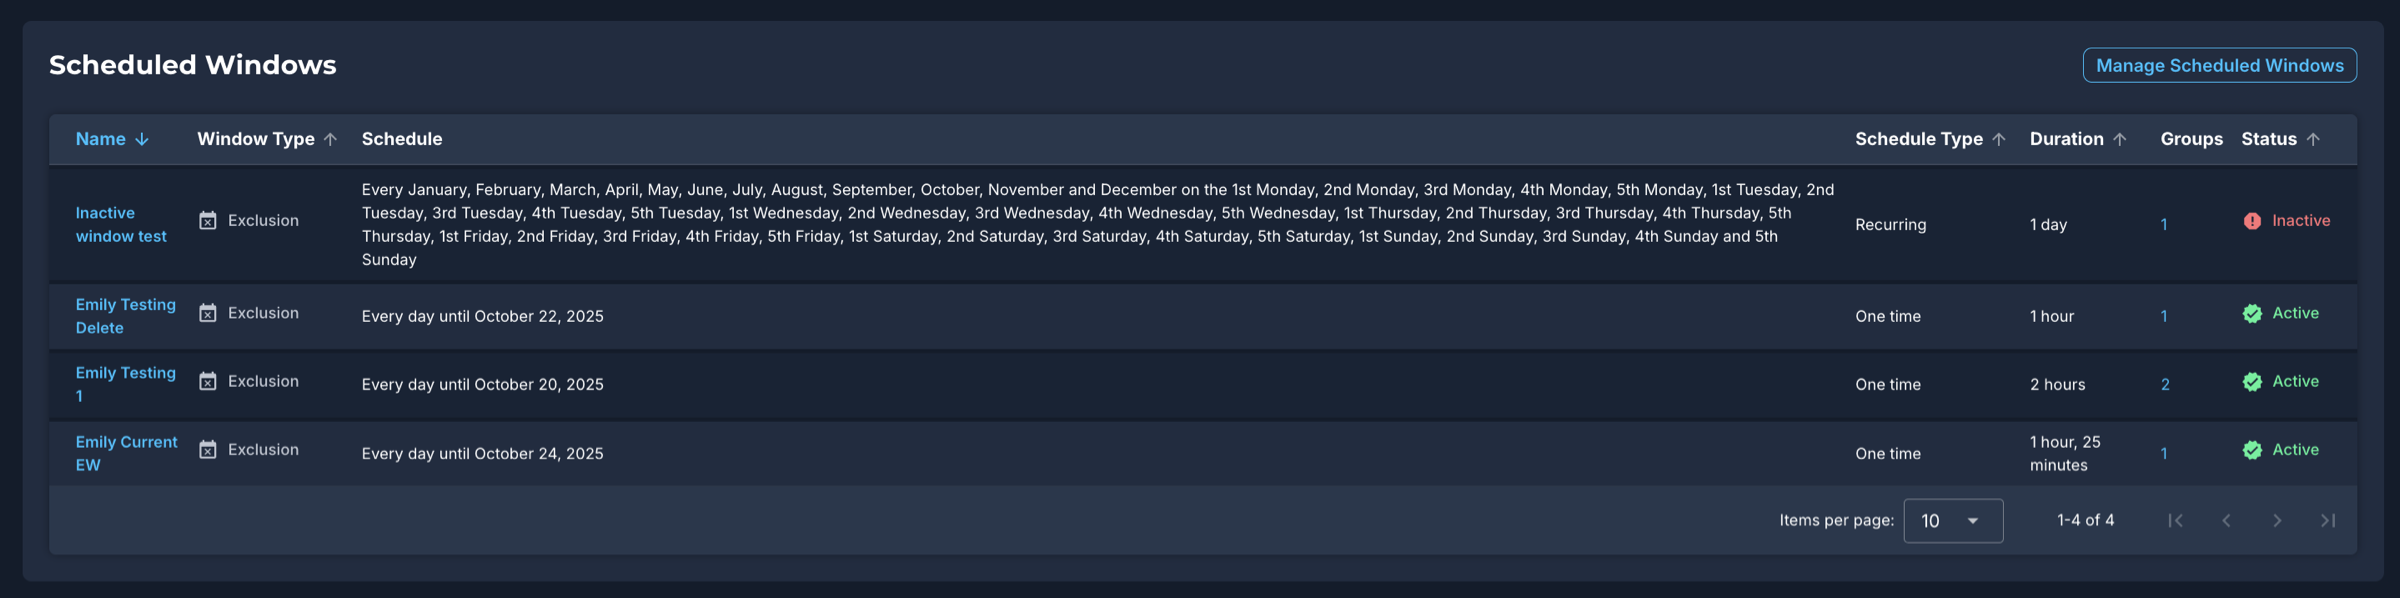
Scheduled Windows
The Scheduled Windows section shows whether the device is in a group that has a scheduled exclusion window, where policies are prevented from executing during that time frame. See Scheduled Windows and Scheduled Windows FAQ for more information. You can also find information about managing scheduled exclusion windows in Managing Exclusion Windows.
Software Associated with a Device
The software associated with an individual device is listed at the bottom of the Device Details page. From here you can search for specific software and carry out bulk actions on installed software.
Use the search box to find specific software that you want to take action on. This search is comparable to Enhanced Device Search, see Filtering and Searching on the Devices Page.
|
Column Name |
Description |
|---|---|
|
Software Name |
Name of the software associated with this device. |
|
Status |
Status of the software on this device. Possible values: update available, installed |
|
Current Version |
Version of the software installed. |
|
Latest Version |
Version of the software that is available for installation. |
| Days Exposed / Date Detected | By default, the Software table shows the Days Exposed. The days are based on the first time the software package was made available in the Automox customer base. To view the date the package was detected, click on the column heading to switch between Days Exposed to Date Detected. |
|
Severity |
This shows the CVE score severity level for the particular software package. When the severity is highlighted in blue, click to view the associated CVE. |
|
Needs Restart |
This shows if a restart is required for this software update. |
Bulk Actions
You can select one or more software packages and select actions from the Bulk Actions drop-down menu.
See also Configuring Software on a Device.
- Roll Back
- Patch
- Ignore
- Defer
- Use Global Settings
