Creating Reports
You can create reports that provide information about the devices in your organization. The following reports are available from the Reports page. To view each type of report, click the corresponding View button
Activity Log
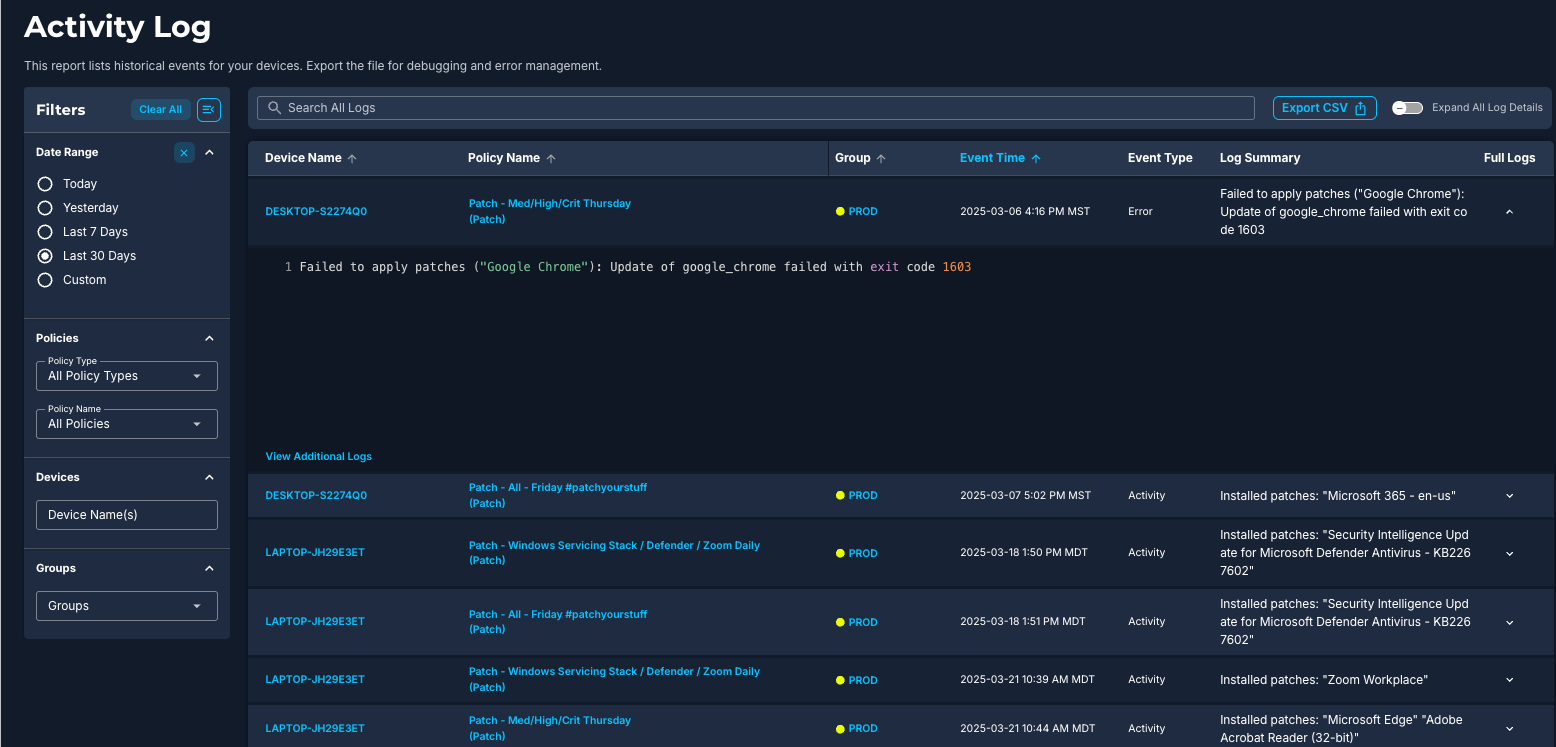
The activity log tracks all automated and manual actions taken over a given period of time on the devices in your organization.
- Use the filter options to create the desired report.
- Click the Export CSV button to export this information to a CSV file.
- Click the name of the device to view the Device Details page.
- Select Full Logs for more information.
Filtering and Searching in the Activity Log
The filter panel to the left of the activity log list includes different types of options to fine-tune your report. You can filter the list of activity logs by date, policy type, policy name, device name, and group. When you select any of the individual filters, the resulting log list automatically updates. You can clear selections individually, or select Reset Filters to clear all.
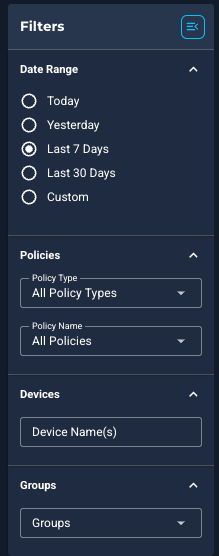
You can hide or show the filter panel, as needed. The filter panel shows by default.
| Filter | Description |
|---|---|
|
Date Range |
Use the Date Range options to find the desired activity log results. The last selection is saved in local storage and becomes the new default. Note:
Select from the filter options to show log results for Today, Yesterday, Last 7 Days, Last 30 Days, or Custom. Use the calendar options to create a custom search. |
|
Policies: Policy Type |
Click the All Policy Types drop-down list to filter results by Patch, Worklet, or Required Software. |
|
Policies: Policy Name |
Click the All Policies drop-down list to filter results by the name of any policy in your organization. |
|
Devices |
Use the Device Name field to search for a specific device or devices. This search shows all entries that match any of the individual search criteria you set. |
| Groups | Use the Groups field to search for specific groups of devices. This search allows you to select multiple groups. |
Search by log details
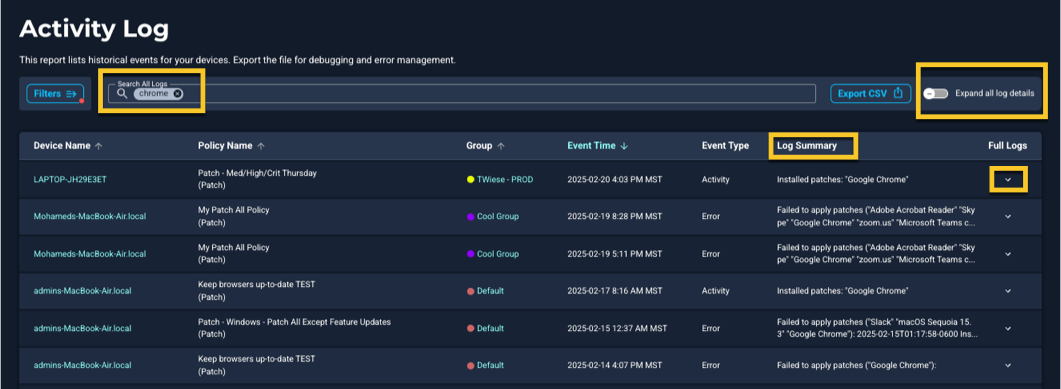
Use the search bar at the top of the Activity Log to find specific details listed in the Log Summary column, such as package names and KB numbers. This helps you quickly find useful log entries.
Click Full Logs for complete information about the logged activity. You can also show all details by turning on the Expand All Log Details toggle.
Each log entry also includes a View Additional Logs link. Clicking this opens the Device Logs on the Device Details page, where you can see logs from recent scans of the device. The types of data shown in these logs are described in Device Details.
By entering a string, the list populates with matching entries. You can use multiple strings to narrow your search results.
Sorting search results
You can sort the list of results by clicking the arrow at the column heading. This type of sort is available for Device Name, Policy Name, Group, and Event Time columns.
Overview Report
The overview report provides a summary of the state of devices in your organization. This includes the device overview, history of patches applied, and patches by group. You can export this report to a PDF.
Navigating the Overview Report
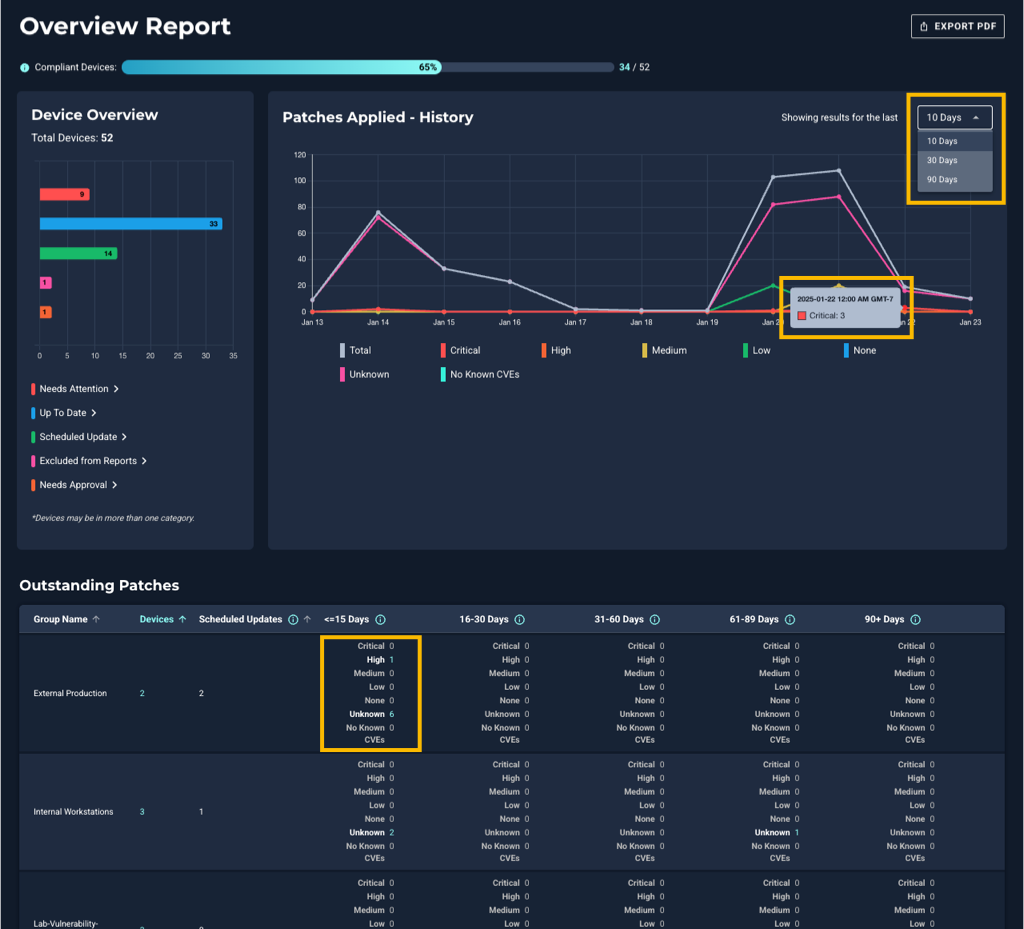
- Hover over points on the charts to reveal details.
- Use the drop-down menu to change the time span of the history.
- Click the severity level legend to turn details on and off.
- Click highlighted text to jump to a filtered list of devices.
- Click Export PDF to download a PDF of this report.
Overview Report - Device Overview
The Device Overview section provides status insights for managed devices.
- Needs Attention
This is the percentage of devices requiring action due to one or more of the following conditions:- Not Compliant: For example, a new patch is detected.
- Needs Restart: A restart is needed to complete installation.
- Disconnected for 30+ Days: The device has not checked in with the Automox API for over 30 days.
- Up To Date
Devices that are compliant with policies and require no further action. - Scheduled Update
This is the percentage of devices with scheduled updates. - Excluded from Reports
Indicates the percentage of devices excluded from reports, which are not included in outstanding patch counts. - Needs Approval
Pertains to manual approval policies where patches await approval before deployment.
Needs Attention Report
This report provides a list of devices that need attention, defined as devices which have one or more of the following statuses:
- Not Compliant
- Needs Restart
- Disconnected for 30+ Days
Any relevant information about the devices is listed here. You can run this report for an individual group or all groups.
Creating a Needs Attention report
- From the Reports page, click View for Needs Attention Report.
- Click Select Group from the drop-down menu. Scroll to select the group you want a report for.
Note: You can select an individual group or All Groups. - The report opens in a new window.
- To switch between groups, select Choose Group Option.
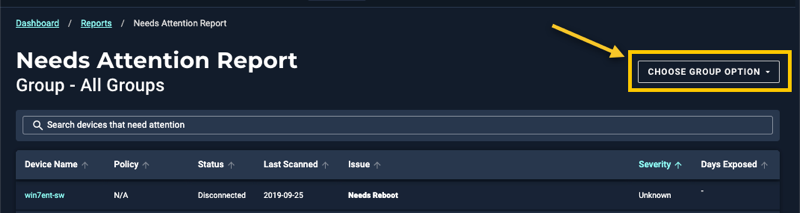
- You can use the search bar to narrow down results
- You can sort by clicking on the column heading
- You can set the page view up to 500 rows
You can spot any devices that need attention. The report includes the following information:
| Needs Attention Report Details | Description |
|---|---|
|
Device Name |
This is the name of the device in your organization. You can search for this name on the Devices page. |
|
Policy |
This field lists any policies the device is associated with. |
|
Status |
This shows the connection status of the device. |
|
Last Scanned |
This shows the last time the system scanned the device. |
|
Issue |
The reason the device needs attention is listed here. |
|
Severity |
The severity level is provided here. See also the following CVE severity scoring table. |
|
Days Exposed |
Calculated based on the first time the package was detected. |
CVE severity scoring
Automox defines severity levels in the following manner:
|
Automox CVSSv2 |
Automox CVSSv3 |
|---|---|
|
|
none (0.0) |
|
Low (0.0—3.9) |
Low (0.0—3.9) |
|
Medium (4.0—6.9) |
Medium (4.0—6.9) |
|
Critical (7.0—10) |
High (7.0—8.9) |
|
Other (Not scored) |
Critical (9.0—10) |
|
|
Unknown |
Pre-patch Report
This report shows you a list of all scheduled patches per device. The severity and exposure information allows you to effectively assess any internal impact to your organization. You can run this report for an individual group or all groups.
Creating a Pre-patch report
- From the Reports page, click View for Pre-Patch Report.
- Click Select Group from the drop-down menu. Scroll to select the group you want a report for.
Note: You can select an individual group or All Groups. - The report opens in a new window.
- To switch between groups, select Choose Group Option.
- To download the report, click Export PDF.
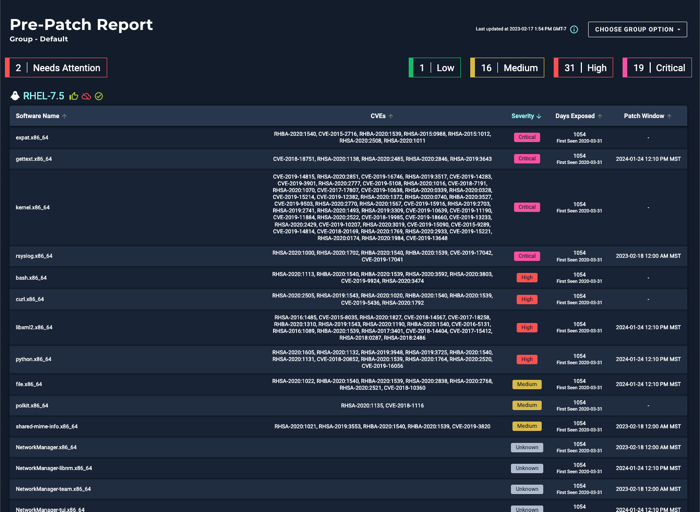
The report includes the following information:
|
Pre-patch Report Details |
Description |
|---|---|
|
Device name and status |
Click the device name to open the corresponding device details page. |
|
Software Name |
Name of the available software |
|
CVE |
CVE associated with the scheduled patch |
|
Severity |
Severity level of the scheduled patch. See also Understanding Automox Severity Data. |
|
Days Exposed |
Calculated based on the first time the package was detected |
|
Patch Window |
The date and time that the update will start |
