Automox Console Dashboard
The Dashboard![]() The default landing page of the Automox Console that shows device/policy status overview. is the default landing page for the Automox console
The default landing page of the Automox Console that shows device/policy status overview. is the default landing page for the Automox console![]() Our web-based management dashboard, available at https://console.automox.com.. With this page, you can view all your device
Our web-based management dashboard, available at https://console.automox.com.. With this page, you can view all your device![]() A subset of Assets, a general term denoting anything that runs the Automox Agent and is registered with the system. and policy
A subset of Assets, a general term denoting anything that runs the Automox Agent and is registered with the system. and policy![]() Represents a set of logic statements that define the desired target state of a device, the allowed remediation schedule, and configuration parameters around how that remediation should take place. status information at a glance. The dashboard provides access links for troubleshooting, an overview of outstanding patches
Represents a set of logic statements that define the desired target state of a device, the allowed remediation schedule, and configuration parameters around how that remediation should take place. status information at a glance. The dashboard provides access links for troubleshooting, an overview of outstanding patches![]() A software security or stability update., and a timeline view of scheduled policies.
A software security or stability update., and a timeline view of scheduled policies.
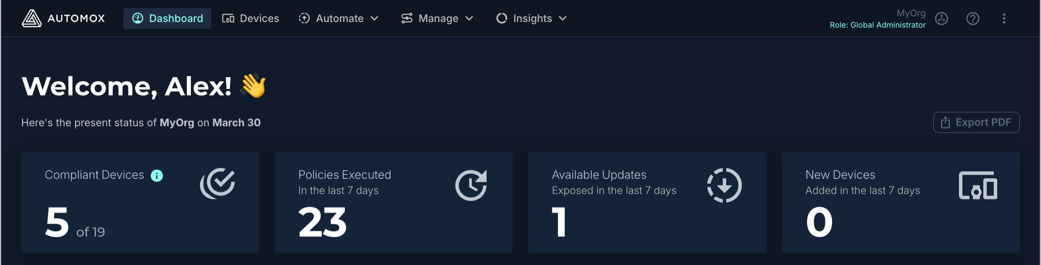
You can download the contents of this page to a PDF. To do this, click Export PDF.
Status Tiles
At the top of the Automox dashboard, you can identify the organization![]() A subset of an account. An Automox customer account can be tied to multiple organizations, and users can be invited to, and access multiple organizations. An organization contains users, devices, and policies. and status date for the dashboard you are viewing. The first set of tiles provide an overview of device and policy status. These status tiles are described here.
A subset of an account. An Automox customer account can be tied to multiple organizations, and users can be invited to, and access multiple organizations. An organization contains users, devices, and policies. and status date for the dashboard you are viewing. The first set of tiles provide an overview of device and policy status. These status tiles are described here.
| Status tile name | Description |
|---|---|
|
Compliant Devices |
Shows the number of devices that are up-to-date based on their policies and schedules. Click to open the list of devices filtered for Compliant. |
|
Policies Executed |
Shows the number of policies that have run in the last 7 days. Click to open a list of these policy run results. |
|
Shows the number of available updates that have been exposed within the last 7 days. Click to open a list of available software updates. |
|
|
New Devices |
Shows the number of devices added to your organization within the last 7 days. Click to open a list of recently added devices. |
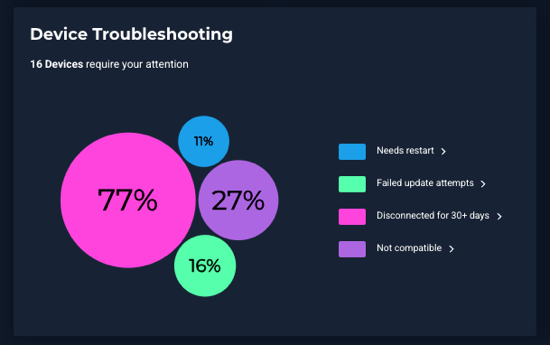
Device Troubleshooting
Use the Device Troubleshooting section to review any devices that need attention.
| Device Troubleshooting status | Description | Click graph or status |
|---|---|---|
| Needs restart | The device has patches or software installed that require a restart before installation can be fully completed. | Click to open the list of Devices filtered for Needs Restart |
|
Failed update attempts |
View all devices that failed to successfully install new patches. Manual intervention might be required. |
Click to open the list of Devices filtered for Failed Update Attempts |
|
Disconnected for 30+ days |
View devices that are not connected. You cannot take any patching actions until these devices are connected again. |
Click to open the list of Devices filtered for Disconnected 30+ Days |
|
Not compatible |
View devices that do not pass the compatibility check. See the Troubleshooting section of the Device Details page for more information. |
Click to open the list of Devices filtered for Not Compatible |
Outstanding Patch Count
This grid shows both scheduled or available patches in relation to the number of days a patch has been left unpatched. These patches can be part of either active or inactive policies. The number of devices affected by any of the outstanding patches is listed below the grid. A device might have more than one outstanding patch.
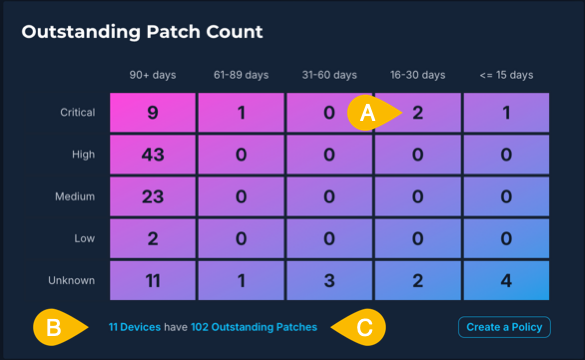
- Click any patch count number to view the Software page filtered by the severity level and days exposed.
- Click the highlighted devices link after the grid to view a list of all devices with outstanding patches.
- Click the highlighted outstanding patches link to view a list of all software patches that impact devices in your environment.
- Software marked as ignored (set directly in the software table and not through a policy filter)
- Devices that are excluded from reports
Recommendation: Perform a rescan of any device marked as ignored to ensure it is accurately recorded.
Use this information to determine which policies to review and activate, if necessary.
Scheduled Policies
You can view all scheduled policies from the Scheduled Policies scrolling timeline. These are organized in tabs by policy type. Note: This shows the policy schedule in local time, even if the scheduled policy is in UTC.

- The main View All tab shows the next 40 scheduled policies.
- The tabs by type depend on the policies you have configured. To view a list of scheduled policies for a specific policy type, click the corresponding tab. This will list up to 40 scheduled policies per type.
- Click the name of the policy to open that individual policy page.
- Click View Devices to open the list of devices filtered by that policy.
- Click View Policies to view a list of all policies.
Environment by OS
The Environment by OS chart shows the device OS distribution for the current organization.
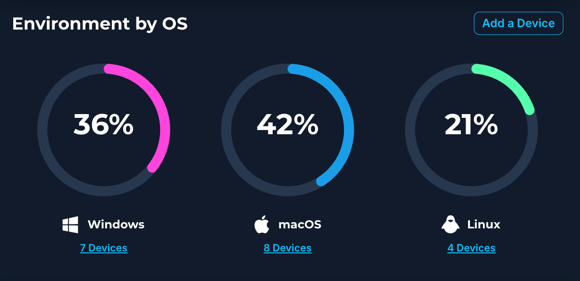
- Click the number under the OS to open the devices page filtered by that specific operating system.
- Click Add a Device to install the Automox agent on your device. See also Automox Agent Installation Overview.
Device Health by Group
The Device Health by Group chart provides a count of devices that have had an outstanding patch within the timeframe selected, shown by group. These are sorted in descending order.
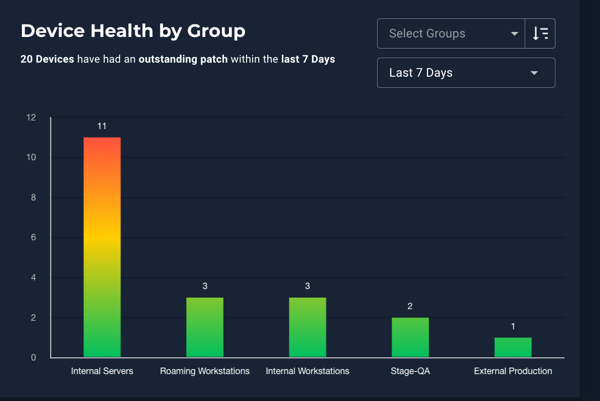
Click Select Groups to select specific groups or Select All from the drop-down list. You can use the search bar to find specific groups.
Select from the different lengths of time to view device groups with available outstanding patches for that period of time. The number above the column shows the number of devices.
- You can select from different time periods, such as: 0–7 days (Last 7 Days), 0–30 days (Last 30 Days), 0–90 days (Last 90 Days), or 0–180 days (Last 180 Days).
- The default time period is 7 days.
- If no groups are selected, the first 10 groups are shown in descending order.
When you click inside a group column, the Devices page opens filtered by that group and specific period of time.
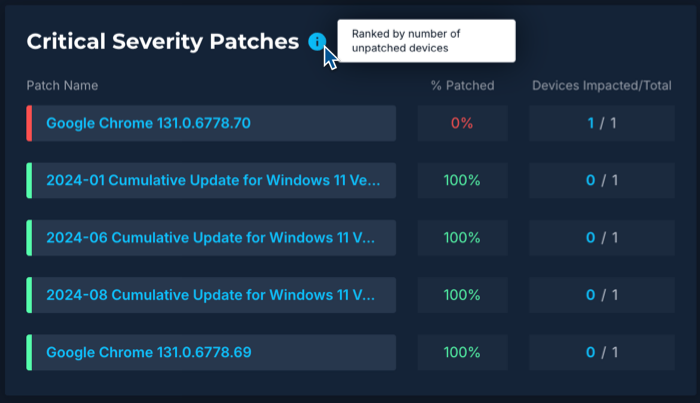
Critical Severity Patches
The Critical Severity Patches table shows the top 5 critical patches in your environment. The list starts with the highest number of devices not patched.
| Critical Severity Patches table | Description |
|---|---|
|
Patch Name |
Name of the software update (patch). Click name to open the Software page. |
|
% Patched |
Shows the percentage of devices that have been patched. |
|
Devices Impacted/Total |
Lists the number of devices impacted by the patch. The highlighted number of devices need to be patched. You can click the number to open the Devices page filtered by the impacted devices. The bottom number (Total) is all devices in your environment with the patch. |
Next Steps Guide
When you initially access the console, you will find patch policy recommendations that you can access directly from the dashboard under Next steps for Automox Demo.
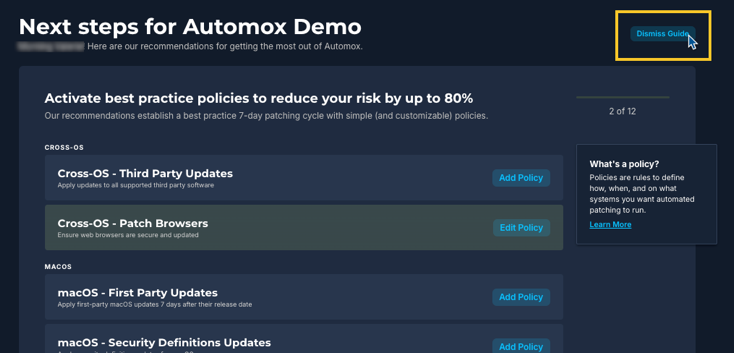
If you close (Dismiss) these recommendations, you can still access the policy templates in the Automation Maturity Playbook of Automox University.
Navigation
The interface navigation is above the dashboard.
Note: New top navigation uses the following options: Dashboard, Devices, Automate, Manage, and Insights.
From Automate you can access:
- Policies, Worklet Catalog, and Remediations
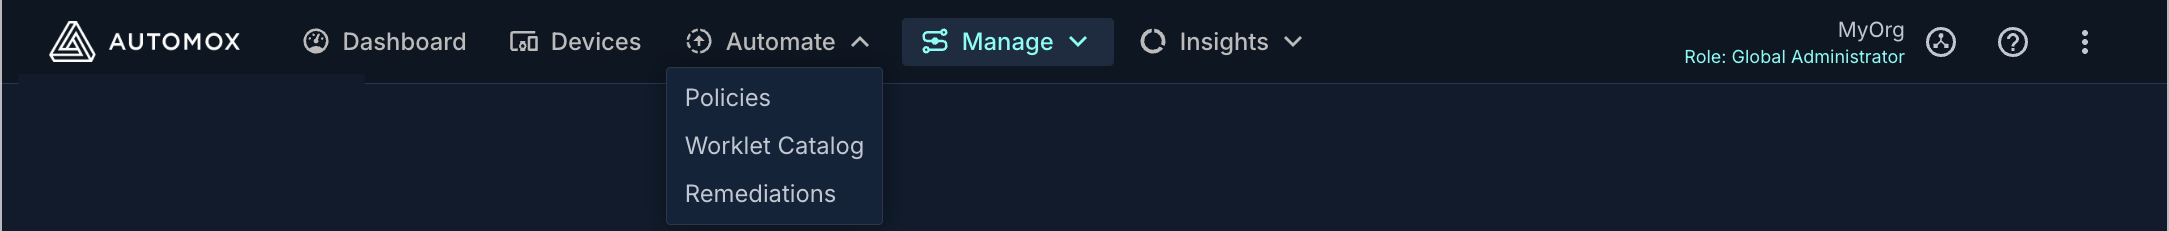
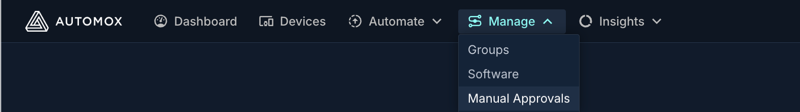
From the Manage tab you can access:
- Groups, Software, and Manual Approvals
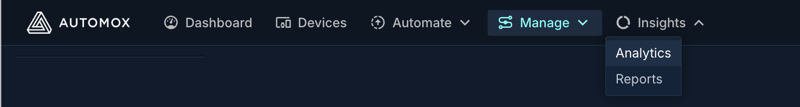
From Insights you can access:
- Analytics and Reports
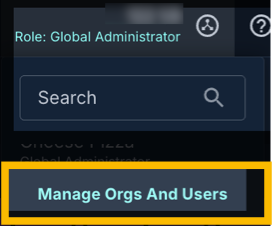
Managing Your Organization
You can manage organizations and users by selecting the top navigation menu next to your name. Depending on your permissions, you can create a new organization from here. For more information, see Managing Organizations.
Help
Click the question mark at the top of the console to access the following links:
- Knowledge Base: This opens the Customer Portal where you can find Knowledge Base articles and submit requests to the Automox support team.
- Release Notes: As an active customer, you have access to Automox product documentation and agent release notes.
- Technical Release Feed: A subscribable feed that provides updates on technical releases and related documentation changes.
- Community: Join the Automox community to find time-saving resources and best practices.
- API Reference Guide: This opens the Automox Developer Portal, where you can find API documentation and other developer resources.
- Automox University: Access to the free Automox on-demand training platform.
Settings
To access settings for your account, in the upper right, click the menu icon to open the drop-down list of options.
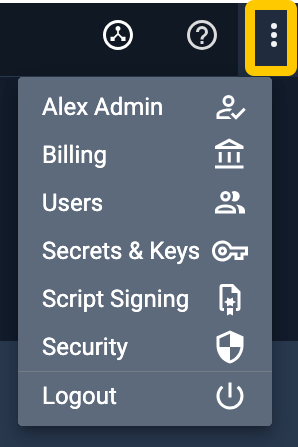
Depending on your permissions, you can access your profile, billing information, user account details, secrets, keys (API and access keys), script signing, and security settings such as two-factor authentication. Refer to Roles and Permissions Management.
For additional help, please submit a support request through the customer portal.
