Analytics
You can access reports to track patching progress and identify security gaps. Browse prebuilt reports to analyze your device management data.
Viewing and Filtering Analytics Reports
To view analytics reports, go to Insights → Analytics in the console. These reports include data from all organizations that you have permissions to view.
From the Analytics page, choose the type of reports you want to view from the Select Board list. You can currently select from these boards:
| Name of board | Description |
|---|---|
| Health and Device Status | These reports offer a deep dive into individual device health and status, providing critical insights into update readiness, patching needs, and potential issues for effective troubleshooting. |
| Organization Insights | These reports provide a comprehensive snapshot of your organization, detailing operating system distribution, licensing, and connection status. |
| Patch Impact and Performance Reports | This board tells the story around applying patches irrespective of vulnerability, providing actionable reporting around patch activity and predictability on the impact of applying patches within an environment. |
| Policy Execution | These reports collectively provide a granular overview of policy execution, success, and failure rates across organizations, alongside a detailed breakdown of policy results. |
| Risk and Mitigation Reports | This board tells the story around applying patches respective of vulnerability, providing actionable reporting around patch activity and predictability on the impact of applying patches within an environment. |
| Organizational Risk and Patch Trend | This board delivers risk and patch trend data that highlights how a customer's environment is changing over time, how well risk and patches are being addressed and offers more insight into how Automox is helping to remediate and automate tasks. |
You can perform the following actions on the different boards:
- Filter: Filter the available reports
- Download PDF: Download the data as a PDF
- Present: Present reports for larger, detailed views
- Schedule: Create a schedule to send a PDF, XLSX, or CSV by email
- Hover: Hover over individual reports to view more information
Filtering Reports
You can apply several filters to refine the data shown in analytics reports. The available filters depend on the board you select.
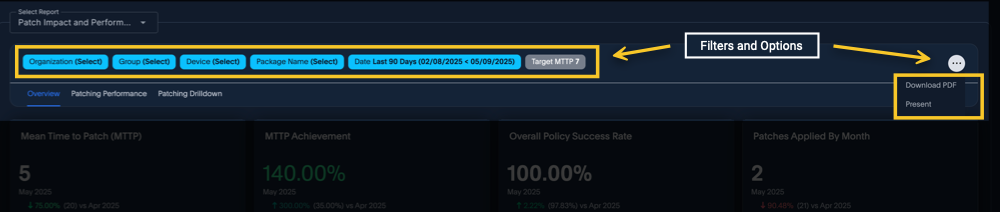
The following filters are available:
- Date Last 90 Days: Select a value to filter policy events by. Data beyond 90 days may not be available, even if included in your filter.
- Days Since Last Disconnect: Select to filter by the number of days a device was last disconnected. The default setting is 3 days.
- Device: Select one or more devices to filter by. By default, all devices are selected.
- Group: Select one or more groups to filter by. By default, all groups are selected.
- Install Date Last 90 Days: Select to view analytics based on a rolling install date or a fixed date range. While the date filter allows you to select a wider range, the report will only include up to 90 days of data. Data beyond 90 days from the selected end date may not be available, even if included in your filter.
- Operating System: Select one or more operating systems to filter by. By default, all operating systems are selected.
- Organization: Currently, if you are logged into a specific organization, the reports show data for all organizations you have permissions to view. Use the Organization filter to include or exclude organizations, depending on your permissions and preferences.
- OS Family: Select one or more operating systems to filter by. The available options are Linux, Mac, and Windows.
- Package Category: Select from options such as browser, communication, utility, and other. By default, all options are selected.
- Package Name: Select one or more packages to filter by. By default, all packaged are selected.
- Package Source Type: Select from first-party or third-party packages. By default, both are selected.
- Policy: Select one or more policies to filter by. By default, all policies are selected.
- Policy Type: Select one or more policy types (Patch, Required Software, or Worklet) to filter by. By default, all policy types are selected.
- Severity: Use the Severity filter to include or exclude specific CVSS severity levels.
Note: For more information, see Understanding CVE Scoring and Severity Data. - Target MTTP: You can change this value. Use this filter to select a target Mean Time to Patch (MTTP) value from 1 through 30.
- Target MTTR: You can change this value. Use this filter to select a target Mean Time to Remediate (MTTR) value from1 through 30.
See the Glossary section for details.)
Additional Filters
For the Patch and Impact Performance board, you can select from additional filters for groups of reports based on these categories.
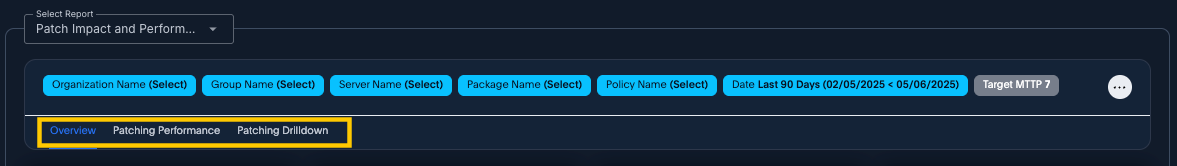
- Overview
- Patching Performance
- Patching Drilldown
Available Actions
In addition to the Download PDF button available from the board, you can interact with individual reports using the following actions:
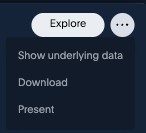
- Explore: Provides access to additional filters and customization options to refine the data further
- Show Underlying Data: Displays the detailed data that supports the report’s metrics
- Download: Exports the report in your preferred format: CSV, XLSX, or PNG
- Present: Opens the report in a larger, more detailed view for closer inspection
- Alerts: You can select Create alert (bell icon) and Manage alerts. For more information about alerts, see Analytics Board and Report Scheduling.
Managing Customized Views
You can save any filter modifications you make to the analytics board in a customized board view. You can add, delete, and manage custom views for yourself.
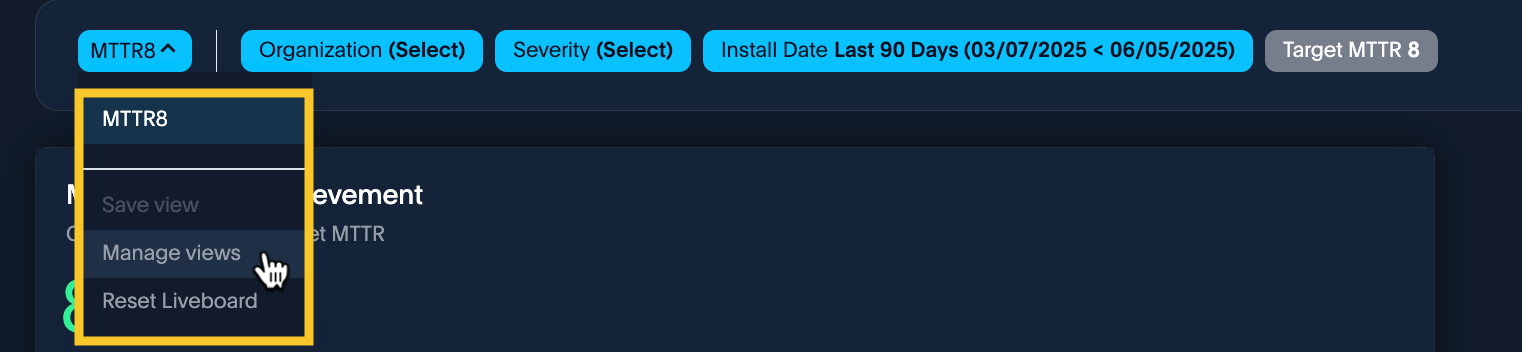
- When you modify a filter and apply the change, the Save view option appears along with the filters. You can apply multiple filters to the same view or create individual custom views.
- Click Save view and enter a custom name that reflects the new board view.
- To switch back to the default view, select Reset Liveboard from the drop-down menu.
- Select Manage views to edit custom view names or delete a custom board view.
 Patch Impact and Performance Reports
Risk and Mitigation Reports
Health and Device Status
Organization Insights
Policy Execution
Organizational Risk and Patch Trend
Understanding CVE Scoring and Severity Data
Automox Analytics reports include CVE and CVSS Severity information to help you interpret vulnerabilities more effectively.
CVSS Score
The CVSS Score is a numerical value from 0 to 10 that represents a qualitative measure of severity.
Automox Analytics displays the most current score available in this priority order:
- CVSSv4
- CVSSv3
- CVSSv2
If no CVSS score is available, the system displays NULL.
CVSS Severity
The CVSS Severity is a text (string) representation of the numerical CVSS range that reflects the most recent severity available. If no severity is available, the value is NONE.
Report Calculation Methodology
To support accurate interpretation of analytics data, this section provides the calculation methodology for each report. Reports are grouped into categories based on their focus areas:
- Report Calculation Methodology - Security and Patch Performance: Includes the Patch Impact and Performance and Risk and Mitigation boards. These boards focus on patching activity and effectiveness, with or without a vulnerability context.
- Report Calculation Methodology - Operational Insights\: Includes the Health and Device Status, Organization Insights, and Policy Execution boards. These boards provide operational visibility into devices, policies, and organization-level metrics.
- Report Calculation Methodology – Organizational Risk and Patch Trend This board focuses on tracking changes in risk exposure, vulnerability remediation, and patch activity over time.
Automox adds additional boards over time, and each includes its own methodology section as applicable.
Report Calculation Methodology - Security and Patch Performance
This section explains how analytics calculates metrics for each report using defined formulas and associated variables.
- Patch Impact and Performance
- Risk and Mitigation
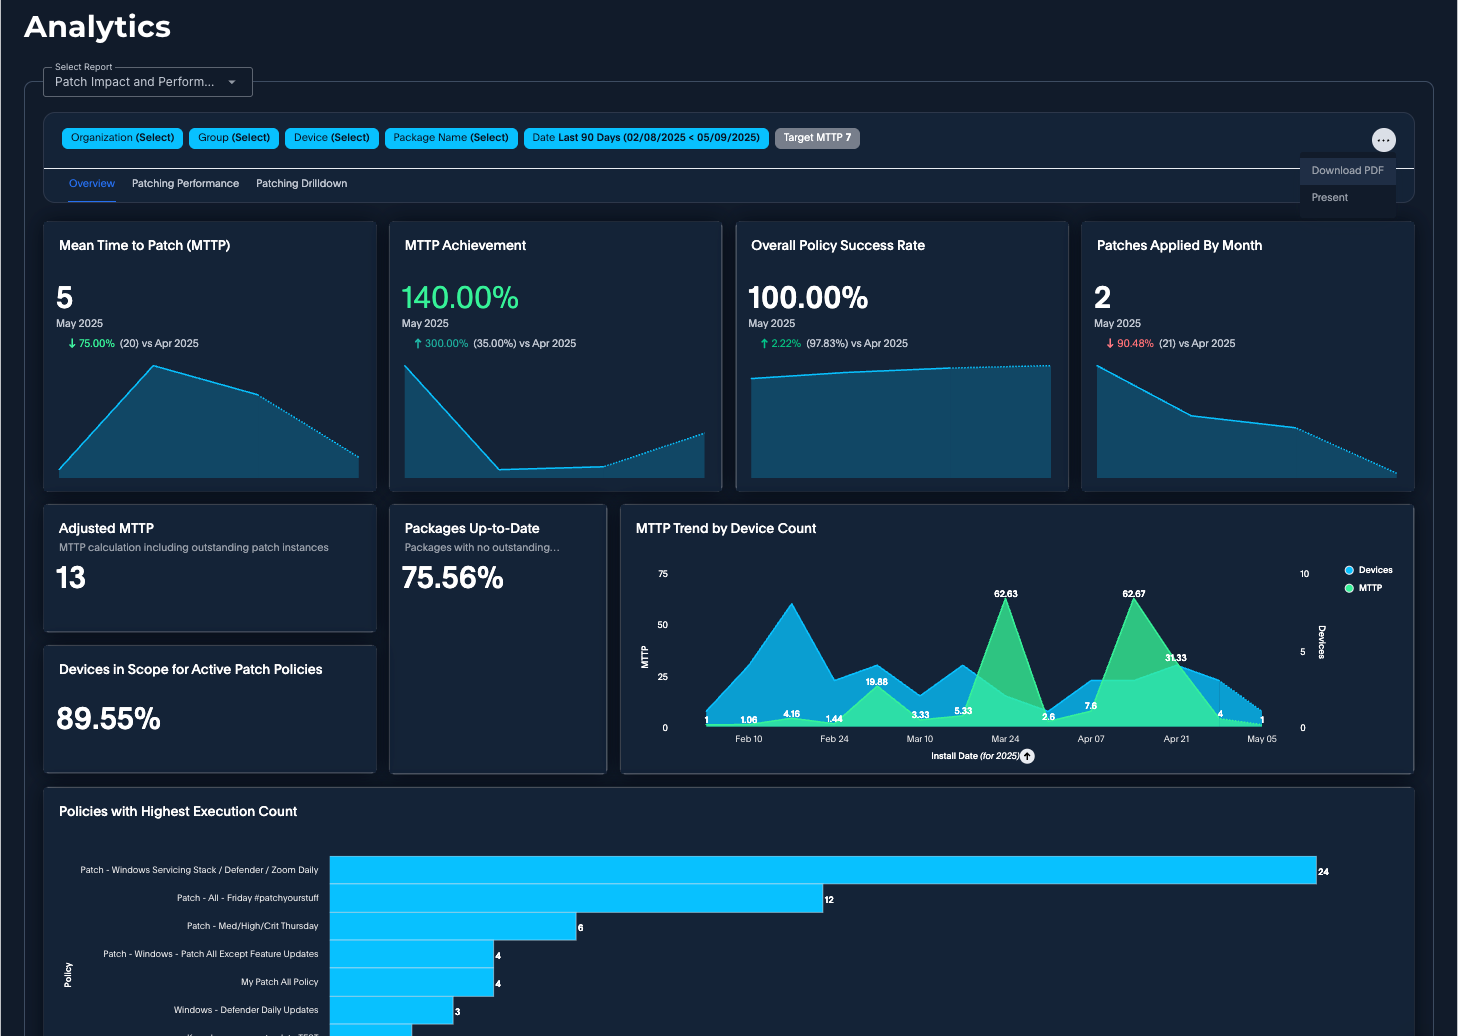
This describes the calculations for the Patch Impact and Performance reports. You can select reports from three tabs: Overview, Patching Performance, and Patching Drilldown. This list provides the calculations used for the patch impact and performance reports.
Overview
Mean Time to Patch (MTTP)
- Formula MTTP:
sum ( Day Diff ) / Package Count - Variables: MTTP, Install Date Monthly
- Description: Displays the average number of days it takes to apply a patch to a device, calculated from the package creation timestamp (when the patch was first available) to the install timestamp (when the patch was successfully applied on a device). This metric currently measures the patch time per patch instance. This answer also compares data to the previous month's data.
MTTP Achievement
- Variables: MTTP Achievement, Install Date Monthly
- Description: Compares the current MTTP to the Target MTTP Parameter defined by the end user and displays a percentage rate of achievement. This answer also compares data to the previous month's data.
Overall Policy Success Rate
- Formula Success Rate: safe_divide ( Policies Succeeded, Total Policy Executions)
- Variables: Success Rate, Event Time Monthly, Policy Type = Patch
- Description: Displays the percentage of patch policies that executed successfully (exit code 0) in the environment based on the selected time interval.
Patches Applied By Month
- Variables: Package Count, Install Date Monthly
- Description: Displays the number of patch instances successfully applied each month within the selected timeframe. This report compares the current month's performance against the previous month to highlight trends and progress over time
Adjusted MTTP
- Variables: Adjusted MTTP, Device Package Count, Diff in Days
- Description: Shows MTTP including outstanding patch instances. Projects MTTP if all outstanding patches were applied today.
Devices in Scope for Active Patch Policies
- Formula In Scope Policy Devices: safe_divide ( Total Active Patch Policy Devices, Total Devices )
- Variables: In Scope Policy Devices
- Description: Displays the number of devices that are currently in scope based on active patch policies, considering any applied device filtering. This helps to distinguish between the total device count and those actively managed by patch policies.
Packages Up-to-Date
- Formula Fully Patched Percentage:
Fully Patched Package Count / Total Package Count - Variables: Fully Patched Percentage
- Description: Shows the percentage of installed software packages that are fully patched across the environment.
MTTP Trend by Device Count
- Variables: MTTP, count Server ID, Install Date Weekly
- Description: Displays a weekly trend of MTTP and devices in scope.
Policies with Highest Execution Count
- Variables: Total Policy Executions, Policy Name, Event Time Monthly
- Description: Lists patch policies ranked by the number of executions within the selected time interval. This helps identify which policies are most active, either due to a broad device scope or a more aggressive scheduling strategy.
Applied Packages by Patch Instance Count
- Variables: Package Name, Package Count
- Description: Shows how often each patch was applied within the selected time interval.
Applied Packages by Device Count
- Variables: Package Name, count Server ID
- Description: Shows the number of unique devices that have received a specific package within the selected time interval.
Patching Progress by Device Count
- Variables: Package Name, Installed Device Count, Outstanding Device Count
- Description: Sorted by Total Device Count
Outstanding Packages by Device Count
- Variables: Server Name, Package Count, Installed = False
- Description: Displays devices with the highest number of outstanding patches.
Patching Performance
Patch Policy Success
- Variables: count Policy ID, Status Name
- Description: Displays the success and failure rate of ALL policies (Patch, Worklet, and Required Software) in the environment based on the filtered time interval.
Patch Policy Execution History
- Variables: count Policy Event ID, Status Name, Policy Type = Patch, Event Time Weekly
- Description: Tracks successful and failed patch policy executions over the selected time interval.
Applied Patch Instances by OS Family
- Variables: Package Count, OS Family, Install Date Weekly
- Description: Displays the count of applied patch instances by operating system family.
Patching Progress by Outstanding Device Count
- Variables: Package Name, Installed Device Count, Outstanding Device Count
- Description: Displays the number of devices running the latest version of a package in comparison to those still pending the latest patch.
Patch Policy Schedule
- Variables: Organization Name, Hour 24, Policy ID Count by Hour
- Description: Displays the policy schedule based on the hour of day and broken out by organization. This report provides insights into how policies are scheduled and helps determine if adjustments are needed to optimize execution timing.
Patch Policy Executions
- Variables: count Policy ID, Organization Name, Policy Event Hour hour of day, Policy type = Patch
- Description: Displays when patch policies have executed, broken down by the hour of day. This report shows the distribution of policy execution times and can help determine if policies are running as scheduled or if adjustments are necessary.
Patching Drilldown
Applied Package History
- Variables: Package Name, Server Name (Device), Install Date detailed, Is Managed = True
- Description: Lists packages that have successfully applied over the time interval. Note: This only includes devices that have successfully completed the GetSoftware scan to ensure accuracy in reporting package status.
Recently Executed Patching Policies
- Variables: Policy Name, Server Name (Device), Status, Policy Name
- Description: Lists patching policies that have most recently been executed.
Patching Progress by Outstanding Device Count
- Variables: Package Name, Installed Device Count, Outstanding Device Count
- Description: Lists the number of devices running the latest version of a package in comparison to those still pending the latest patch.
Outstanding Packages by Device
- Variables: Package Name, Server Name, Version, Package Count, Installed = False
- Description: Lists devices with missing patches to highlight patching gaps.
Outstanding Packages by Patch Instance
- Variables: Package Name, Version, count Server ID, Installed = False
- Description: Lists patch instances pending installation, showing the version pending per device.
Return to Report Calculation Methodology.
Risk and Mitigation
This describes the calculations for Risk and Mitigation reports.
Mean Time to Remediate in Days (MTTR)
- Formula MTTR:
SUM (Day Diff) /Remediation Count - Variables: Average Day Diff, Install Date
- Description: Displays the average number of days it takes to remediate a vulnerability instance using Created At (Release date of the package) and Install Timestamp (The timestamp of the scan after package was installed). This answer also compares data to the previous month's data.
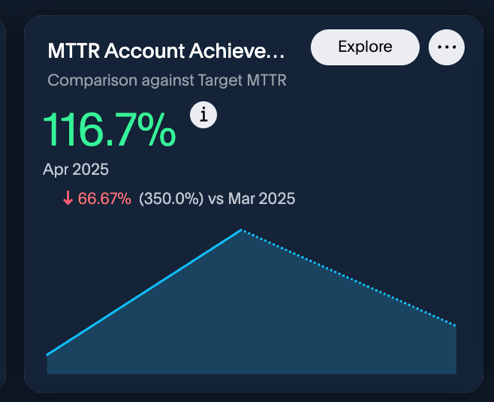
MTTR Account Achievement
Comparison to Target MTTR
- Formula MTTR Achievement:
Target MTTR /MTTR - Variables: MTTR Achievement, Install Date
- Description: Compares the current MTTR to the Target MTTR Parameter defined by end user and displays a percentage rate of achievement. This answer also compares data to the previous month's data.
KEV Vulnerability Instances Remediated
(KEV) Known Exploitable Vulnerabilities
- Variables: Unique Count of Vulnerability Instances, Known Exploitable Vulnerabilities, Install Date
- Description: Displays the number of vulnerability instances with active exploits in the wild that have been remediated this month. This answer also compares data to the previous month's data.
Vulnerability Instances Remediated
- Variables: Unique Count CVE ID, Install Date
- Description: Displays the number of vulnerability instances that have been installed during the install date filter. This also provides comparative analytics for current vs previous month's data.
Remediation Trend by Vulnerability Instance
- Variables: Unique Count Vulnerability Instance, Install Date, CVSS Severity
- Description: Displays a weekly trend of remediated vulnerability instances by severity.
MTTR Trend vs Number of Devices In Scope
- Variables: Average Day Diff, Install Date, Unique Count of Devices
- Description: Displays a weekly trend of MTTR and devices in scope.
Projected MTTR
Anticipated MTTR based on active policy schedule pattern
- Variables: Average Days Between Active Policy Schedules
- Description: Provides the projected MTTR based on active patch policy schedules.
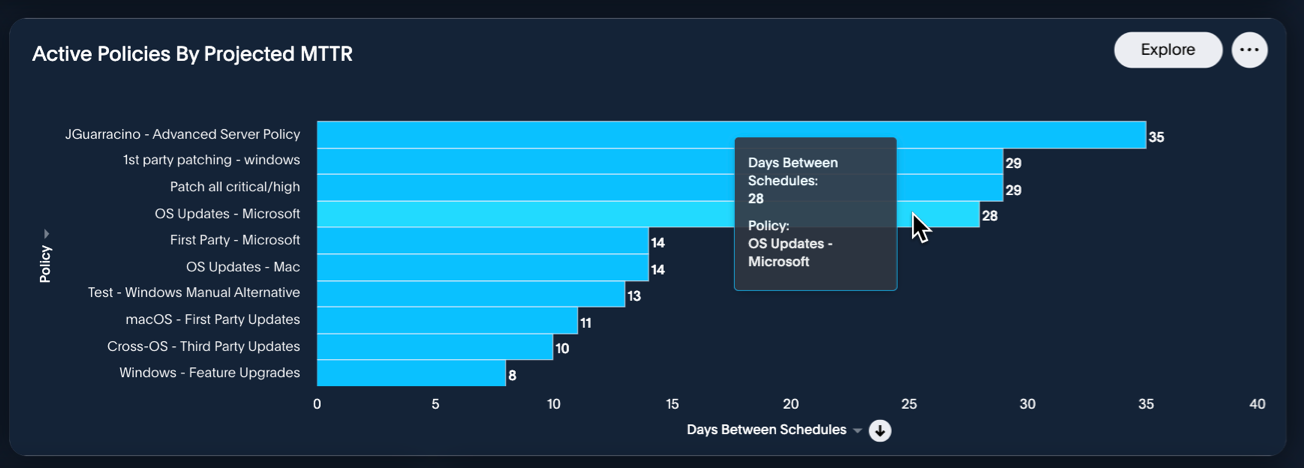
Active Policies By Projected MTTR
- Variables: Policy Name, Average Days Between Schedules
- Description: Provides a ranked list of patch policies with the largest gap in schedules.
Top Active CVEs By Exposure In Days
- Formula Days Exposed:
CURRENT_DATE - Package Version Created At
- Variables: Max Days Exposed, CVE ID, CVSS Severity
- Description: Displays the top 10 CVEs based on active exposure in days. Conditional logic for the colors ranges from Yellow to Red. Any CVE with a maximum exposure in days greater than 90 days will be red.
Vulnerabilities Remediated by Severity
- Variables: Unique Count Vulnerability Instances, Severity
- Description: Displays a total count of installed vulnerability instances based on the Install Date filter.
MTTR Target Breach by Exposure in Days
- Variables: Package Display Name, Severity, Max Exposure in Days > Target MTTR
- Description: Provides the top packages in breach of the MTTR Target sorted by exposure in days. Conditional color scheming is based on CVSS Severity.
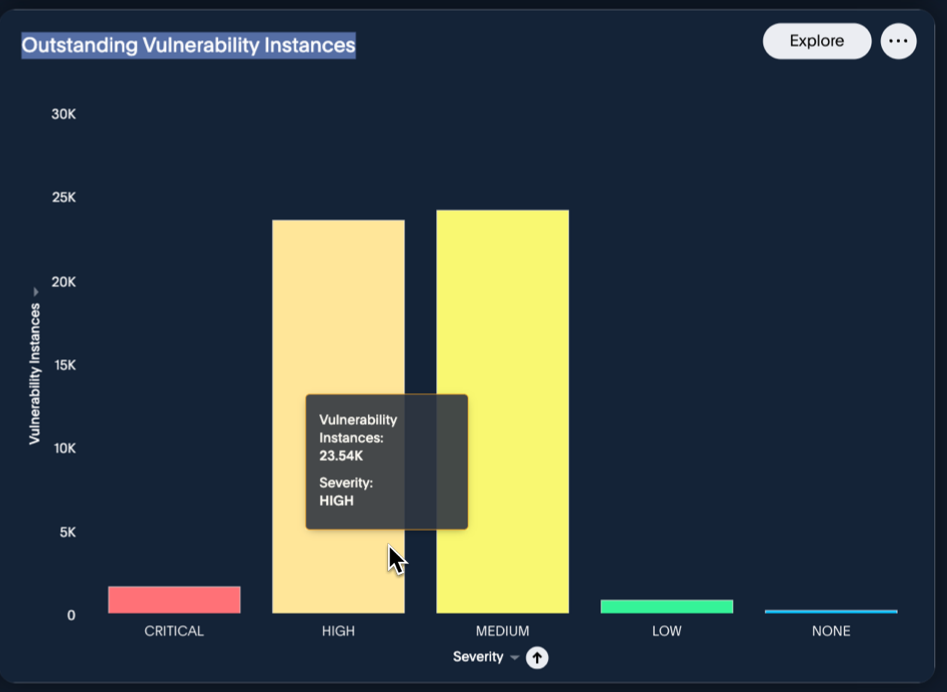
Outstanding Vulnerability Instances
- Variables: Unique Count of Vulnerability Instances, CVSS Severity
- Description: Displays the total number of vulnerability instances that are outstanding in the environment over all time.
Return to Report Calculation Methodology.
Report Calculation Methodology - Operational Insights
This section explains how analytics calculates metrics for each report using defined formulas and associated variables.
- Health and Device Status
- Organization Insights
- Policy Execution
Health and Device Status
This describes the calculations for Health and Device Status reports.
Patch Policies Successful by Month
- Variables: Policy Event ID, Policy Type, Event Time, Success
- Description: Displays a date trend chart showing the number of successful patch policy executions over the previous month.
Patch Policies Successful
- Variables: Policy Event ID, Policy Type, Success
- Description: Displays the number of successful patch policy executions over the selected date filter.
Devices Requiring Restart
- Variables: Deleted, Needs Reboot, Server ID
- Description: Displays the number of devices in the organization that need to be restarted.
Average Package Exposure by CVSS Severity and OS
- Variables: Average Package Exposure, CVSS Severity, OS Family
- Description: Provides outstanding patch instances by CVSS severity and OS Family
Not Compatible Device Count
- Variables: Server ID, Compatibility
- Description: Displays the number of deployed devices that are not compatible with Automox
Last Scan Failed by Device Count
- Variables: Server ID, Last Scan Failed
- Description: Displays the number of deployed devices that failed their last scan.
Outstanding Patch Instances - Packages In-Scope with Active Policies
- Variables: Package ID, Installed, Policy Scope
- Description: Displays the number of patches that are yet to be installed and are associated with a policy.
Outstanding Patch Instances - Includes Out-of-Scope Packages
- Variables: Package ID, Installed
- Description: Displays the number of patches that are yet to be installed regardless of association with a policy.
Patch Instances Requiring Restart
- Variables: Pending Patches, Reboot Required
- Description: Displays the number of patches that are available, regardless of policy association, and require a restart to be installed.
Outstanding Critical Patch Instances
- Variables: Package Version ID, Installed, CVSS Severity
- Description: Displays the number of patches that are not installed that have a CVSS score of Critical.
Outstanding Patch Instances by CVSS Severity
- Variables: Package Version ID, Installed, CVSS Severity
- Description: Displays a pie chart showing a breakdown of available patches by the CVSS severity, regardless of policy association.
Device Health by Group
- Variables: Group Name, Server ID, Device Health
- Description: Displays a stacked bar graph showing the amount of healthy and unhealthy devices, organized by group.
Devices Not Compatible
- Variables: Compatibility, Server ID, Compatibility, Organization Name
- Description: Displays a heatmap showing the number of deployed devices that are not compatible with Automox, grouped by organization name and incompatibility detail.
Outstanding Critical Patches by Organization and Group
- Variables: Package Version ID, Organization Name, Installed, Group Name, CVSS Severity
- Description: Displays a stacked bar graph showing the number of patches that are not installed, regardless of policy association, grouped by organization name and group name.
Devices Requiring Restart by Organization and Group
- Variables: Organization Name, Group Name, Server ID, Needs Reboot
- Description: Displays a stacked bar graph showing the number of devices that require a restart, grouped by organization name and group name.
Last Scan Failed by Organization and Group
- Variables: Organization Name, Group Name, Server ID, Last Scan Failed
- Description: Displays a stacked bar graph showing the number of devices that failed their last scan, grouped by organization name and group name.
Return to Report Calculation Methodology - Operational Insights.
Organization Insights
This describes the calculations for Organization Insights reports.
Subscription
- Variables: Account Sub Systems
- Description: Displays the maximum number of devices the organization has licenses for.
Device Count
- Variables: Server ID, Deleted
- Description: Displays the current number of active devices in the organization.
Max Device Count
- Variables: Device Count, Date Trend
- Description: Displays the total number of devices added over the previous date filter.
Devices Deployed
- Variables: Server Count, Max Sub Systems, Deleted
- Description: Displays the percentage of non-deleted systems compared against the organization’s license.
Group Count
- Variables: Group UUID
- Description: Displays the number of groups within the organization.
Recently Added Devices
- Variables: Server ID, Create Time, Deleted
- Description: Displays a line graph of the devices created during the selected date filter.
Deployment Trend by Day
- Variables: Date Trend daily, Organization Name, Max Device Count, Subscribed Systems
- Description: Displays a line graph showing deployed devices by day compared against the maximum amount of devices allowed, limited by the date filter.
Environment by OS
- Variables: Server ID, OS Family, Deleted
- Description: Displays a pie chart showing the percentage breakdown of deployed devices by the OS Family (Windows, Mac, Linux).
Connection Status by Device Count
- Variables: Server ID, Deleted, Connection Status
- Description: Displays a bar graph showing the total number of devices that are connected (shown in green) and disconnected (shown in red).
OS Distribution
- Variables: OS Family, OS Name, Server ID, Deleted
- Description: Displays a Sankey chart showing a detailed number of deployed devices by specific operating system name.
Disconnected Devices 1–30 Days
- Variables: 1–30 Days, Server ID, Deleted
- Description: Displays the number of devices that have been disconnected between 1 and 30 days.
Disconnected Devices 31–60 Days
- Variables: 31–60 Days, Server ID, Deleted
- Description: Displays the number of devices that have been disconnected between 31 and 60 days.
Disconnected Devices 61–90 Days
- Variables: 61–90 Days, Server ID, Deleted
- Description: Displays the number of devices that have been disconnected between 61 and 90 days.
Disconnected Devices Greater than 90 Days
- Variables: > 90 Days, Server ID, Deleted
- Description: Displays the number of devices that have been disconnected for more than 90 days.
Disconnected Devices Breakdown
- Variables: Server Name, Days Since Last Disconnect, Last Disconnect Time Updated, Server ID, Organization Name, Deleted
- Description: Displays a table of disconnected devices with details about how long each device has been disconnected, sorted by Days Since Last Disconnect.
Return to Report Calculation Methodology - Operational Insights.
Policy Execution
This describes the calculations for Policy Execution reports.
Policy Success Rate
- Variables: Success Rate, Event Time
- Description: Displays a graph showing overall policy execution success rate for the selected date filter.
Policy Executions by Month
- Variables: Policy Event ID, Event Time
- Description: Displays a graph showing the total number of policy executions for the selected date filter.
Unique Policy Executions
- Variables: Policy ID, Event Time
- Description: Displays the number of unique policies executed for the selected date filter.
Policy Count
- Variables: Policy ID
- Description: Displays the total number of policies in an organization.
Active Policy Count
- Variables: Auto Patch
- Description: Displays the total number of policies that are active, with Auto Patch set to true.
Unscheduled Worklets with Associated Groups
- Variables: Server Group ID, Policy Type, Scheduled
- Description: Displays the total number of worklet policies associated to groups that do not have a schedule.
Policy Execution Status by Date
- Variables: Policy Event ID, Event Time weekly, Success string
- Description: Displays a stacked area graph showing the number of policy executions by result (success or failure) over time.
Policy Success Rate by Type
- Variables: Policy Type, Success Rate
- Description: Displays a bar graph showing the success rate of policies by policy type.
Policy Count by Type
- Variables: Policy ID, Policy Type
- Description: Displays a pie chart showing the number of policies grouped by policy type.
Policy Execution Count by Status and Type
- Variables: Policy Event ID, Policy Type, Event Time, Status Name
- Description: Displays a stacked bar graph showing the number of policy executions grouped by policy type and result (success or failure), , limited by the date filter.
Scheduled Policies by Type
- Variables: Policy ID Count by Hour, Hour 24, Policy Type
- Description: Displays a stacked bar graph showing the number of scheduled policies by hour of the day and policy type.
Return to Report Calculation Methodology - Operational Insights.
Report Calculation Methodology – Organizational Risk and Patch Trend
This section provides the calculation methodology for the Organizational Risk and Patch Trend board. These reports focus on tracking changes in risk exposure, vulnerability remediation, and patch activity over time.
Risk Reduction Trend
- Variables: Vulnerability Instances, Date, CVSS Severity
- Description: Displays a KPI chart showing the change in vulnerability instances between the current month and the previous month.
Net Patch Instance Delta
- Variables: Sum of the net change patch instances, Date
- Description: Displays a KPI chart showing the sum of all changes for patch instances by comparing the current month to the previous month.
KEV Reduction Trend
- Variables: Max In Kev for time period, Date
- Description: Displays a KPI chart showing the change in Known Exploitable Vulnerability (In KEV) instances between the current month and the previous month.
Average Days Risk Exposure by Month
- Variables: Average number of exposure days, Date
- Description: Displays KPI chart showing the average number of days vulnerabilities were exposed in the environment, comparing the current month to previous months.
Net Risk Delta
- Variables: Sum of the net change in risk, Date
- Description: Displays a KPI chart showing the sum of all changes for risk using CVSS scores comparing the current month to the previous month.
Risk Score by CVSS Severity
- Variables: Risk Score, Date, CVSS Severity
- Description: Displays an area chart showing the trend of Risk sliced by CVSS severity.
Remediation Vulnerability Instances by CVSS Severity
- Variables: CVSS Severity, Remediated Vulnerability Instances
- Description: Displays a bar chart showing the number of vulnerability instances that were remediated, broken down by CVSS severity using the board’s date filter.
Patch Instance Trend by Day
- Variables: Patch Instance Count, Date
- Description: Displays an area chart showing the daily trend of patch instances over time.
Average Exposure Days by CVSS Severity
- Variables: CVSS Severity, Date, Average Days Exposed
- Description: Displays a stacked area chart showing the trend of days exposure for vulnerability instances affecting in-scope organizations.
Critical Vulnerability Instance Trend by Device Count
- Variables: Vulnerability Instances, Date, Device Count
- Description: Displays an area chart showing the vulnerability instance trend over time along with a device count over time to view the relationship between vulnerability instance counts compared to the device count.
Strategies for Improving Metrics
You can use insights from the reports to take targeted actions that reduce risk and improve your organization's performance against key metrics. This section provides a few examples to illustrate how to interpret report data and act on it.
- Active Policies By Projected MTTR: This report helps you identify policies with large gaps between scheduled runs. If you notice long intervals for certain policies, consider adjusting their schedules to reduce patching delays. Reducing the time between executions can help you get ahead of vulnerabilities and decrease your overall MTTR.
- Outstanding Vulnerability Instances: Use this report to determine if there’s a high number of unresolved vulnerabilities—the following example shows those with High or Medium severity. If your environment shows elevated counts for these severities, you may need to refine your policies to target them more aggressively and close the gap on remediations.
- MTTR Account Achievement: This report helps you monitor whether your remediation efforts align with the Target MTTR Parameter. If the percentage is low, focus on reducing delays in the patch deployment cycle and consider streamlining approvals or improving device readiness.
Glossary
- Known Exploitable Vulnerability (KEV): A CVE (Common Vulnerabilities and Exposures) that has documented evidence of active exploitation in the wild. These vulnerabilities are typically listed in authoritative sources such as the CISA KEV catalog and represent higher risk due to confirmed use in real-world attacks.
- Key Performance Indicator (KPI): The term KPI refers to metrics used to evaluate progress or change over time. Each KPI chart described compares values across time periods or categories to highlight trends in patching and risk reduction
- Vulnerability Instance: A specific occurrence of a security vulnerability (CVE) on a device or package. Device, Package, Version, and Install Date (historical trend) are attributes that make up this occurrence
CVE Legend
CVSS scores are mapped to the following severities:
| Severity | Severity score range |
|---|---|
| Critical | 9–10 |
| High | 7–8.9 |
| Medium | 4–6.9 |
| Low | 0.1–3.9 |
| None | 0.0 |
