Automox Splunk Integration
The Automox Splunk apps are applications released to Splunkbase, which consist of two primary components:
In combination, these two apps allow you to pull Automox console Our web-based management dashboard, available at https://console.automox.com. data consisting of device A subset of Assets, a general term denoting anything that runs the Automox Agent and is registered with the system., policy Represents a set of logic statements that define the desired target state of a device, the allowed remediation schedule, and configuration parameters around how that remediation should take place., and event information into Splunk Enterprise or Splunk Cloud platforms and they enable you to visualize and search across the imported Automox data.
Installation
You can install both the Automox Technology Add-On for Splunk and the Automox Dashboard for Splunk apps either through your Splunk instance or with a more manual process of downloading the package from Splunkbase to install manually. The following sections outline both options.
You must first install and configure the Automox Technology Add-On app before the Automox Dashboard The default landing page of the Automox Console that shows device/policy status overview. for Splunk can populate with any visualizations or searches. In organizations A subset of an account. An Automox customer account can be tied to multiple organizations, and users can be invited to, and access multiple organizations. An organization contains users, devices, and policies. where visualizations are custom tailored, the Automox Dashboard for Splunk is a nice starting point; however, it is not required to receive value from the Automox data imported with the Technology Add-On.
Install within Splunk
When you install apps from within a Splunk instance, follow these steps:
- On the home page left menu, select + Find More Apps.
- From the Browse More Apps page, search for Automox.
-
Click Install for both apps:
- Automox Dashboard for Splunk
- Automox Add-On for Splunk
- Provide Splunkbase credentials and submit.
Download and Install from Splunkbase
When you install the apps from Splunkbase, first log in to Splunkbase and then download the two app packages. After you download these, follow these steps:
- On the home page, select the Apps menu and then click Manage Apps.
- Select Install app from file.
- Select the downloaded app packages.
- Perform a restart of Splunk when prompted.
When the installation is complete, the apps are visible under the Apps menu in Splunk.
Configuring the Technology Add-On
After you install the Automox Technology Add-On, you must configure it to enable the collection of data from Automox. This configuration requires two steps:
Connection Setup
Within the Splunk interface, navigate to the Apps menu and click Automox Add-On for Splunk.
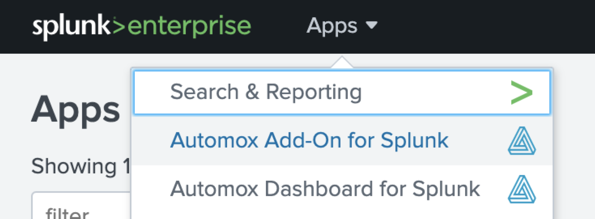
This takes you to the configuration items as part of the add-on. Select the Configuration tab, which allows you to create and manage connections, configure proxy settings, and configure the log settings. In most environments, it is only necessary to create a new connection:
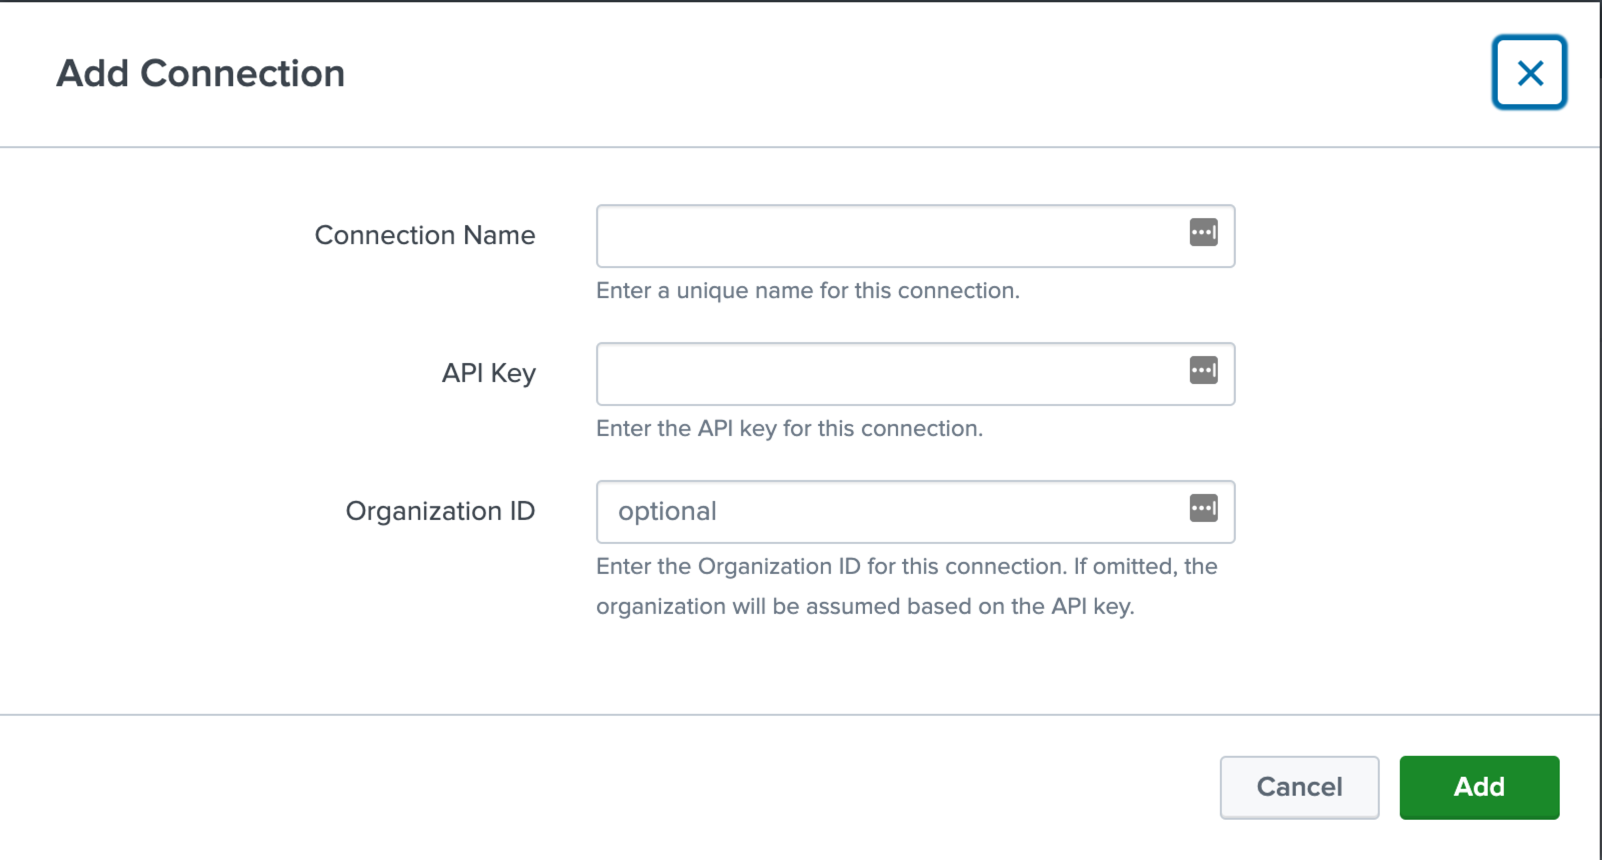
To add a new connection, provide details for the following:
- Connection Name: A unique name provided to your connection to reference during input configuration.
- API Key: An Automox API key is required to pull details from the Automox API. Refer to Managing Organization Keys for details about how to create a new API key.
- Organization ID: This is a required ID. This is valid for both single and multi-org environments.
After you configure at least one connection, define the inputs for the add-on.
Input Creation
The add-on currently provides three types of inputs that you can configure:
- Automox Event Import
- Automox Endpoint Import
- Automox Policy Details Import
You can configure each input independently to allow flexibility in which data to import into a Splunk environment. To configure a new input, select Create New Input and then select which import to use.
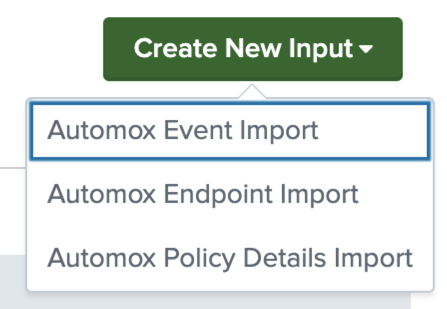
When configuring an input, you must provide:
- Name: A unique and descriptive name for the input
- Interval: Define the number of seconds to wait between each input collection
- Index: The index to import events into Splunk from the input
- Connection: The name of the connection configured in the previous section
Automox currently recommends the following settings for Interval for each input type:
| Input | Interval Value (in seconds) | Description |
|---|---|---|
| Automox Event Import | 3600 | Every hour |
| Automox Endpoint Import | 86400 | Once per day |
| Automox Policy Details Import | 86400 | Once per day |
Due to the nature of the data pulled through the Automox API, currently only the Event Import input type allows you to only import "new" events. This input uses an internal checkpoint to track when it last imported an event, ensuring duplicate events are not received.
Conversely, the Endpoint and Policy Details inputs pull all data each time the inputs run. This is why Automox recommends running the Endpoint Import and Policy Details Import only one time per day.
Collected Data Types
All data collected by this add-on contains a source beginning with "automox_". The source type of the data varies by the events associated with the input. The following table provides a breakdown of input to sourcetypes imported:
|
Input |
Source |
Sourcetypes |
|---|---|---|
|
Automox Event Import |
automox_event_import |
automox:console:events |
|
Automox Endpoint Import |
automox_endpoint_import |
automox:endpoint |
|
Automox Policy Details Import |
automox_policy_details_import |
automox:policy |
Dashboards
After you import Automox data into Splunk with the Automox Technology Add-On, you can start visualizing the events. The Automox Dashboard for Splunk provides an out of the box and convenient way to visualize endpoints, policies, and events. Install the Dashboard app and navigate to it from within the Splunk interface:
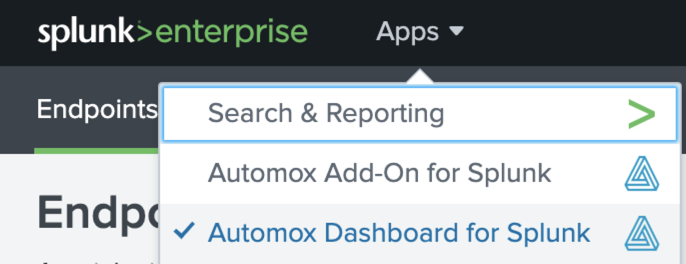
This app provides three dashboards: Endpoints, Policy Details, and Console Events. Each dashboard lets you select the index where imported events are stored, additional filtering such as groups and tags for devices, and the time period of the data.
Remember, this dashboard provides a starting point for end users. Automox encourages adding new visualizations to dashboards to better visualize based on business needs.
Searches
You can use the following example searches after you configure the Technology Add-On.
- List the different Automox sourcetypes with counts:
index=* source=automox_*- List the number of compliant and non-compliant endpoints:
index=* sourcetype="automox:endpoint"- List the number of endpoints by operating system:
index=* sourcetype="automox:endpoint"- List the different Automox console events with counts:
index=* sourcetype="automox:console:events"Troubleshooting
See the following troubleshooting topics.
Logs
To troubleshoot any issues, particularly with the Technology Add-On, collect and review the logs from both the Splunk environment and the add-on logs.
If you are pulling the logs from the Splunk host directly, they are usually located here: <SPLUNK_HOME>/var/log/splunk/
The most useful logs to review are:
ta_automox_add_on_for_splunk_automox_endpoint_import.logta_automox_add_on_for_splunk_automox_event_import.logta_automox_add_on_for_splunk_automox_policy_details_import.logsplunkd.log
Each of these log files correlate to the respective input as well as the splunkd.log file used for troubleshooting any larger environment related issues.
You can also query directly within the Splunk interface for logs resulting from the add-on.
- Navigate to Search & Reporting and search for:
index="_internal" sourcetype="taautomoxaddonforsplunk:log"This provides events from the Automox Technology Add-On for use in diagnostics and troubleshooting. These events show the number of events, endpoints, and policies imported when inputs run, as well as ERROR messages related to issues.
Changing Log Level
If you need more granular logging, you can change the log level of the add-on by following these steps:
- Navigate to Automox Add-On for Splunk from the Apps drop-down menu.
- Select the Configuration tab.
- Within the configuration, select the "Logging" tab
- Change the log level from the default of INFO to DEBUG.
You can also change the log level so that only ERROR or CRITICAL logs are emitted, which reduces logging from the add-on.
No Data is Populated in the Automox Dashboard
This issue is usually related to one of three things:
- The Technology Add-On hasn't been installed or configured yet.
- The index where events are pulled differs from what you configured in the Technology Add-On inputs.
- Events of the specific dashboard were from an earlier time interval (default: Today).
Perform an initial search within Splunk to ensure that events have been imported. Check that you are searching across the correct index. Then increase the time period to include a larger time frame from when the app was installed and configured:
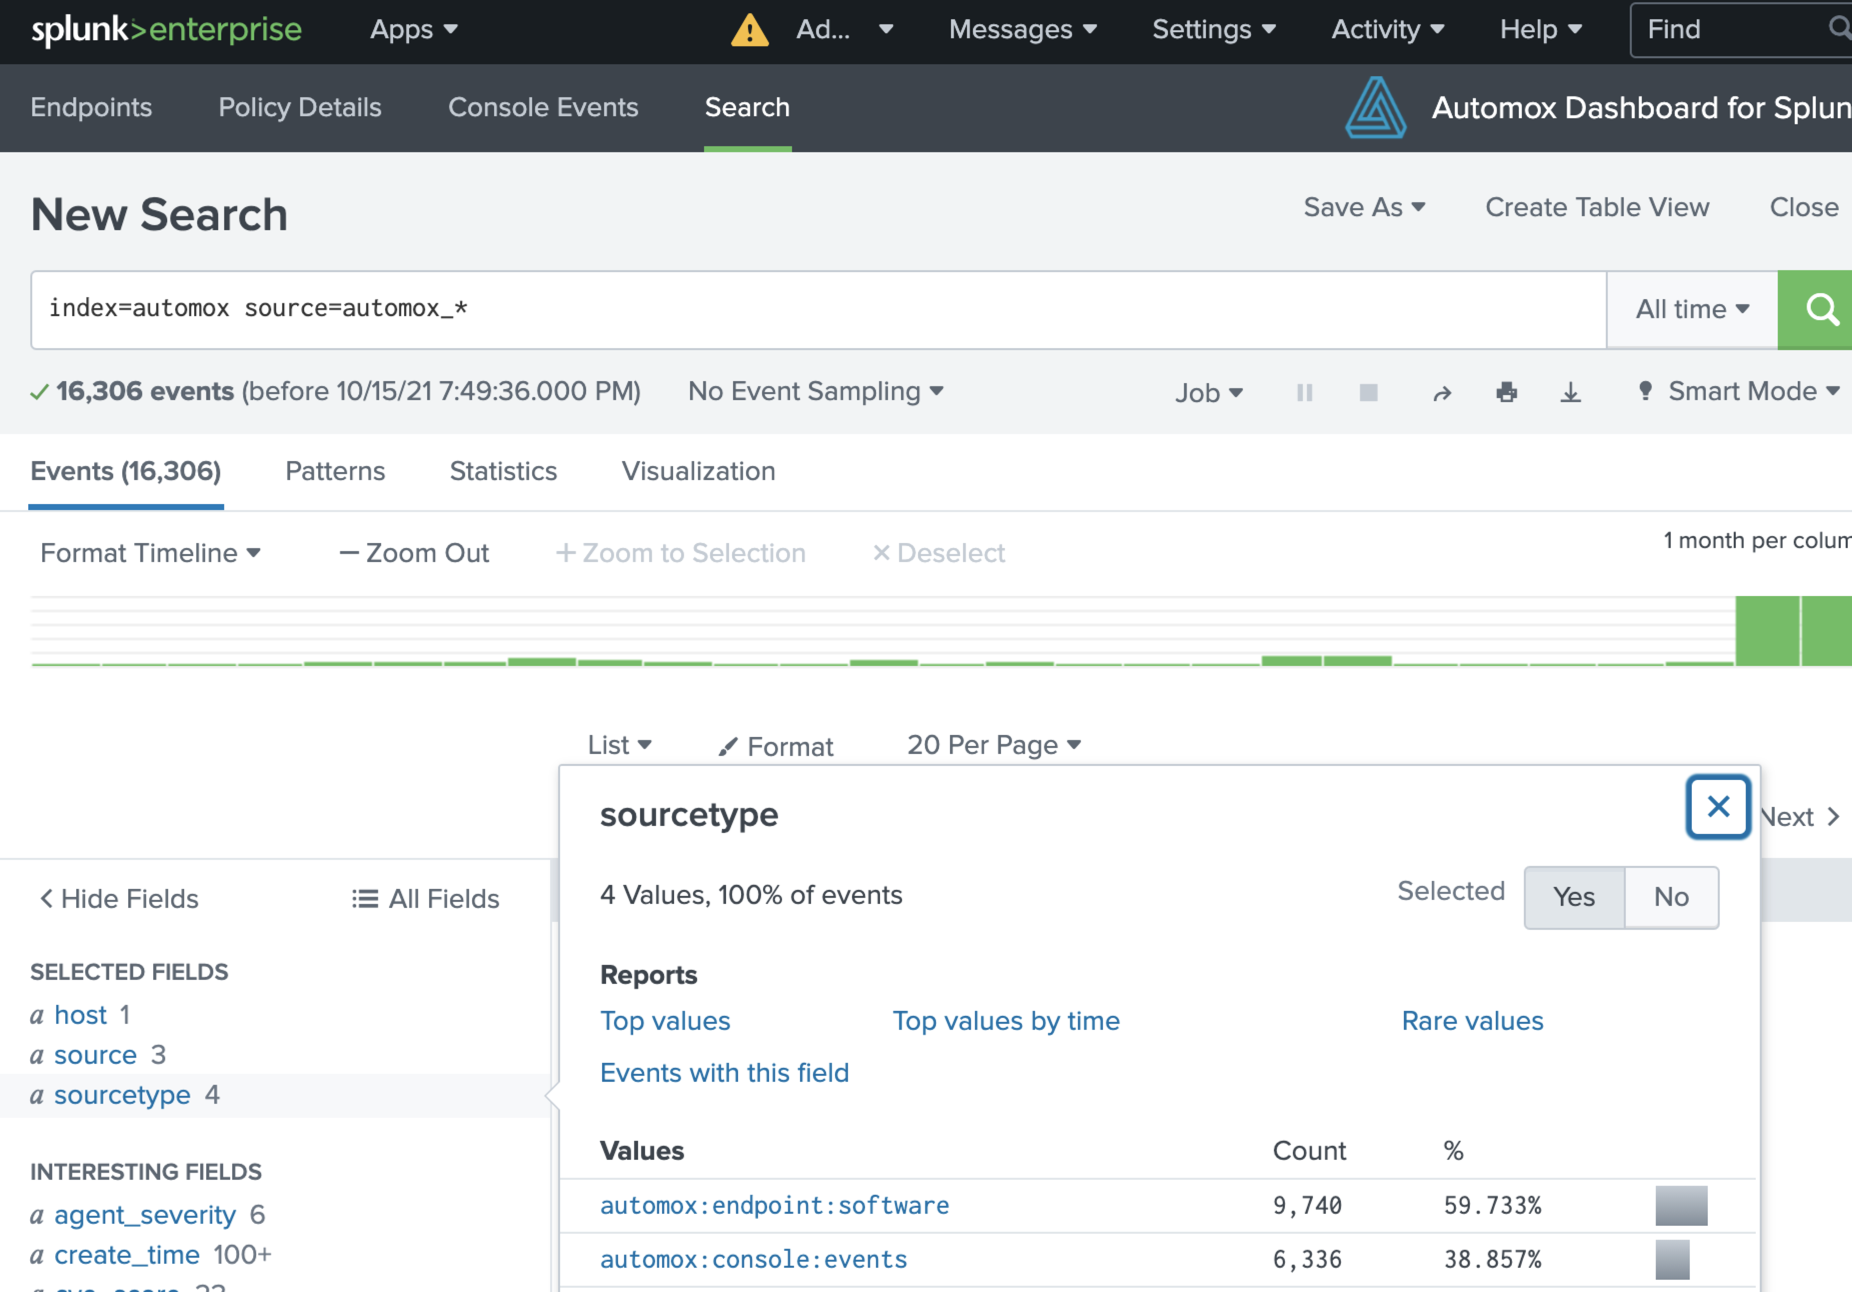
You can use the following example search query:
index=automox source=automox_*If a search finds no events, ensure the inputs are properly configured and review the logs from the Technology Add-On.
